Saks Fifth Avenue 2010 Annual Report Download - page 56
Download and view the complete annual report
Please find page 56 of the 2010 Saks Fifth Avenue annual report below. You can navigate through the pages in the report by either clicking on the pages listed below, or by using the keyword search tool below to find specific information within the annual report.-
 1
1 -
2
-
3
-
4
-
5
-
6
-
7
-
8
-
9
-
10
-
11
-
12
-
13
-
14
-
15
-
16
-
17
-
18
-
19
-
20
-
21
-
22
-
23
-
24
-
25
-
26
-
27
-
28
-
29
-
30
-
31
-
32
-
33
-
34
-
35
-
36
-
37
-
38
-
39
-
40
-
41
-
42
-
43
-
44
-
45
-
 46
46 -
 47
47 -
 48
48 -
 49
49 -
 50
50 -
 51
51 -
 52
52 -
 53
53 -
 54
54 -
 55
55 -
 56
56 -
 57
57 -
 58
58 -
 59
59 -
 60
60 -
 61
61 -
 62
62 -
 63
63 -
 64
64 -
 65
65 -
 66
66 -
67
-
68
-
69
-
70
-
71
-
72
-
73
-
74
-
75
-
76
-
77
-
78
-
79
-
80
-
81
-
82
-
83
-
84
-
85
-
86
-
87
-
88
-
89
-
90
-
91
-
92
-
93
-
94
-
95
-
96
-
97
-
98
-
99
-
100
-
101
-
102
-
103
-
104
-
105
-
106
-
107
-
108
-
109
-
110
-
111
-
112
-
113
-
114
-
115
-
116
-
117
-
118
-
119
-
120
-
121
-
122
-
123
-
124
-
125
-
126
-
127
-
128
-
129
-
130
-
131
-
132
-
133
 |
 |

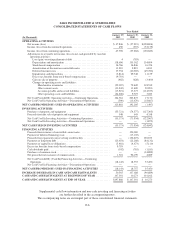
SAKS INCORPORATED & SUBSIDIARIES
CONSOLIDATED STATEMENTS OF CASH FLOWS
Year Ended
(In Thousands)
January 29,
2011
January 30,
2010
January 31,
2009
OPERATING ACTIVITIES
Net income (loss) ................................................. $ 47,846 $ (57,919) $(158,804)
Income (loss) from discontinued operations ............................ 450 (257) (32,179)
Income (loss) from continuing operations .............................. 47,396 (57,662) (126,625)
Adjustments to reconcile net income (loss) to net cash provided by (used in)
operating activities:
Loss (gain) on extinguishment of debt ............................. 4 (783) —
Depreciation and amortization ................................... 118,696 135,162 134,694
Stock-based compensation ...................................... 16,766 16,846 16,354
Amortization of discount on convertible notes ...................... 11,910 9,819 6,811
Deferred income taxes ......................................... 17,354 (40,585) (49,780)
Impairments and dispositions .................................... (2,814) 29,348 11,139
Excess tax benefits from stock-based compensation .................. (9,793) — —
Gain on sale of property ........................................ (482) (628) (3,400)
Changes in operating assets and liabilities:
Merchandise inventories ................................... (22,187) 79,645 118,539
Other current assets ....................................... (13,942) 11,409 20,990
Accounts payable and accrued liabilities ....................... (13,921) 13,577 (114,577)
Other operating assets and liabilities .......................... (24,606) 9,727 3,025
Net Cash Provided By Operating Activities—Continuing Operations ........ 124,381 205,875 17,170
Net Cash Used In Operating Activities—Discontinued Operations .......... (500) (13,670) (18,667)
NET CASH PROVIDED BY (USED IN) OPERATING ACTIVITIES ........ 123,881 192,205 (1,497)
INVESTING ACTIVITIES
Purchases of property and equipment ................................. (55,721) (74,577) (127,305)
Proceeds from the sale of property and equipment ....................... 548 643 4,338
Net Cash Used In Investing Activities—Continuing Operations ............. (55,173) (73,934) (122,967)
Net Cash Used In Investing Activities—Discontinued Operations ........... — — (1,875)
NET CASH USED IN INVESTING ACTIVITIES ........................ (55,173) (73,934) (124,842)
FINANCING ACTIVITIES
Proceeds from issuance of convertible senior notes ....................... — 120,000 —
Payment of deferred financing costs .................................. — (13,105) —
Proceeds from (payments on) revolving credit facility .................... — (156,675) 156,675
Payments of long-term debt ......................................... (23,654) (22,208) (84,132)
Payments of capital lease obligations .................................. (5,481) (4,673) (5,110)
Excess tax benefits from stock-based compensation ...................... 9,793 — —
Cash dividends paid ............................................... (102) (781) (1,183)
Purchases of common stock ......................................... — — (34,889)
Net proceeds from issuance of common stock ........................... 1,301 96,199 4,089
Net Cash Provided By (Used In) Financing Activities—Continuing
Operations .................................................... (18,143) 18,757 35,450
Net Cash Used In Financing Activities—Discontinued Operations .......... — — —
NET CASH PROVIDED BY (USED IN) FINANCING ACTIVITIES ........ (18,143) 18,757 35,450
INCREASE (DECREASE) IN CASH AND CASH EQUIVALENTS ......... 50,565 137,028 (90,889)
CASH AND CASH EQUIVALENTS AT BEGINNING OF YEAR ........... 147,301 10,273 101,162
CASH AND CASH EQUIVALENTS AT END OF YEAR .................. $197,866 $ 147,301 $ 10,273
Supplemental cash flow information and non-cash investing and financing activities
are further described in the accompanying notes.
The accompanying notes are an integral part of these consolidated financial statements.
F-6