Saks Fifth Avenue 2010 Annual Report Download - page 26
Download and view the complete annual report
Please find page 26 of the 2010 Saks Fifth Avenue annual report below. You can navigate through the pages in the report by either clicking on the pages listed below, or by using the keyword search tool below to find specific information within the annual report.-
 1
1 -
2
-
3
-
4
-
5
-
6
-
7
-
8
-
9
-
10
-
11
-
12
-
13
-
14
-
15
-
 16
16 -
 17
17 -
 18
18 -
 19
19 -
 20
20 -
 21
21 -
 22
22 -
 23
23 -
 24
24 -
 25
25 -
 26
26 -
 27
27 -
 28
28 -
 29
29 -
 30
30 -
 31
31 -
 32
32 -
 33
33 -
 34
34 -
 35
35 -
 36
36 -
37
-
38
-
39
-
40
-
41
-
42
-
43
-
44
-
45
-
46
-
47
-
48
-
49
-
50
-
51
-
52
-
53
-
54
-
55
-
56
-
57
-
58
-
59
-
60
-
61
-
62
-
63
-
64
-
65
-
66
-
67
-
68
-
69
-
70
-
71
-
72
-
73
-
74
-
75
-
76
-
77
-
78
-
79
-
80
-
81
-
82
-
83
-
84
-
85
-
86
-
87
-
88
-
89
-
90
-
91
-
92
-
93
-
94
-
95
-
96
-
97
-
98
-
99
-
100
-
101
-
102
-
103
-
104
-
105
-
106
-
107
-
108
-
109
-
110
-
111
-
112
-
113
-
114
-
115
-
116
-
117
-
118
-
119
-
120
-
121
-
122
-
123
-
124
-
125
-
126
-
127
-
128
-
129
-
130
-
131
-
132
-
133
 |
 |
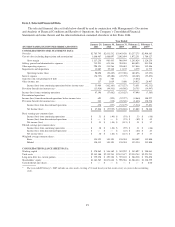
margin rate was principally due to fewer markdowns in the fourth quarter of 2009 compared to the aggressive
markdowns taken in the fourth quarter of 2008 when the Company initiated promotional activities in an effort to
stimulate consumer demand and reduce inventory levels. In addition, the Company achieved SG&A expense
leverage of 20 basis points in 2009 despite a year-over-year sales decrease of $411.9 million.
NET SALES
For the year ended January 30, 2010, total net sales decreased 13.5% to $2,631.5 million from $3,043.4
million for the year ended January 31, 2009. Consolidated comparable store sales decreased $440.6 million, or
14.7%, from $2,987.3 million for the year ended January 31, 2009 to $2,546.7 million for the year ended
January 30, 2010.
GROSS MARGIN
For the year ended January 30, 2010, gross margin was $963.4 million, or 36.6% of net sales, compared to
$980.9 million, or 32.2% of net sales, for the year ended January 31, 2009. The increase in gross margin dollars
and gross margin rate was primarily the result of controlled inventory levels and a more disciplined promotional
and clearance cadence during the year. In 2008, gross margin was negatively impacted by aggressive markdowns
as the Company reacted to the rapidly deteriorating economic conditions and worked to clear excess inventory.
SELLING, GENERAL AND ADMINISTRATIVE EXPENSES
For the year ended January 30, 2010, SG&A was $674.3 million, or 25.6% of net sales, compared to $784.5
million, or 25.8% of net sales, for the year ended January 31, 2009. The decrease of $110.2 million in expenses
was primarily driven by lower variable expenses associated with the year-over-year sales decrease of $411.9
million, as well as other cost savings initiatives implemented by the Company. As a percentage of total net sales,
SG&A decreased by 20 basis points over the prior year.
Amounts received from vendors in conjunction with compensation programs and cooperative advertising
were consistent with the related gross compensation and cooperative advertising expenditures and therefore had
no significant impact on SG&A expense, in dollars or as a percentage of net sales.
OTHER OPERATING EXPENSES
For the year ended January 30, 2010, other operating expenses were $314.3 million, or 12% of net sales,
compared to $320.7 million, or 10.5% of net sales, for the year ended January 31, 2009. The decrease of $6.4
million was principally driven by a decrease in taxes other than income taxes of $7.3 million due to a decrease in
payroll taxes primarily related to the Company’s reduction in force in January 2009 and a decrease in store
pre-opening costs of $0.3 million. These decreases were partially offset by higher depreciation and amortization
expense of $0.5 million and higher property and equipment rentals of $0.7 million.
IMPAIRMENTS AND DISPOSITIONS
For the year ended January 30, 2010, the Company recognized net charges from impairments and
dispositions of $29.3 million compared to net charges of $11.1 million for the year ended January 31, 2009.
These charges were primarily due to asset impairments in the normal course of business.
INTEREST EXPENSE
Interest expense increased to $49.5 million in 2009 from $45.7 million in 2008 and, as a percentage of net
sales, was 1.9% in 2009 and 1.5% in 2008. The increase of $3.8 million was primarily due to the issuance of
$120.0 million of convertible notes in May 2009 and the amortization of financing costs associated with these
25