Saks Fifth Avenue 2010 Annual Report Download - page 15
Download and view the complete annual report
Please find page 15 of the 2010 Saks Fifth Avenue annual report below. You can navigate through the pages in the report by either clicking on the pages listed below, or by using the keyword search tool below to find specific information within the annual report.-
 1
1 -
2
-
3
-
4
-
 5
5 -
 6
6 -
 7
7 -
 8
8 -
 9
9 -
 10
10 -
 11
11 -
 12
12 -
 13
13 -
 14
14 -
 15
15 -
 16
16 -
 17
17 -
 18
18 -
 19
19 -
 20
20 -
 21
21 -
 22
22 -
 23
23 -
 24
24 -
 25
25 -
26
-
27
-
28
-
29
-
30
-
31
-
32
-
33
-
34
-
35
-
36
-
37
-
38
-
39
-
40
-
41
-
42
-
43
-
44
-
45
-
46
-
47
-
48
-
49
-
50
-
51
-
52
-
53
-
54
-
55
-
56
-
57
-
58
-
59
-
60
-
61
-
62
-
63
-
64
-
65
-
66
-
67
-
68
-
69
-
70
-
71
-
72
-
73
-
74
-
75
-
76
-
77
-
78
-
79
-
80
-
81
-
82
-
83
-
84
-
85
-
86
-
87
-
88
-
89
-
90
-
91
-
92
-
93
-
94
-
95
-
96
-
97
-
98
-
99
-
100
-
101
-
102
-
103
-
104
-
105
-
106
-
107
-
108
-
109
-
110
-
111
-
112
-
113
-
114
-
115
-
116
-
117
-
118
-
119
-
120
-
121
-
122
-
123
-
124
-
125
-
126
-
127
-
128
-
129
-
130
-
131
-
132
-
133
 |
 |

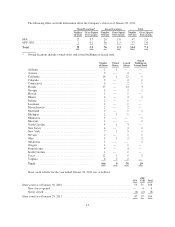
The following tables set forth information about the Company’s stores as of January 29, 2011:
Owned Locations* Leased Locations Total
Number
Of Units
Gross Square
Feet (in mil.)
Number
Of Units
Gross Square
Feet (in mil.)
Number
Of Units
Gross Square
Feet (in mil.)
SFA .............................. 27 3.7 20 1.8 47 5.5
OFF5TH.......................... 1 0.1 56 1.5 57 1.6
Total ............................. 28 3.8 76 3.3 104 7.1
* Owned locations include owned stores and owned buildings on leased land.
Number
of Stores
Owned
Stores
Leased
Stores
Owned
Building on
Leased Land
Alabama ....................................... 1 1 — —
Arizona ........................................ 3 — 3 —
California ...................................... 14 1 12 1
Colorado ....................................... 3 — 2 1
Connecticut .................................... 3 — 2 1
Florida ........................................ 17 — 14 3
Georgia ........................................ 3 — 2 1
Hawaii ........................................ 1 — 1 —
Illinois ........................................ 4 — 3 1
Indiana ........................................ 1 — 1 —
Louisiana ...................................... 1 — 1 —
Massachusetts ................................... 2 — 2 —
Maryland ...................................... 2 — 1 1
Michigan ...................................... 2 1 1 —
Minnesota ...................................... 1 — — 1
Missouri ....................................... 1 — — 1
North Carolina .................................. 4 1 3 —
New Jersey ..................................... 4 — 3 1
New York ...................................... 7 1 5 1
Nevada ........................................ 2 — 1 1
Ohio .......................................... 5 1 2 2
Oklahoma ...................................... 1 — — 1
Oregon ........................................ 1 — 1 —
Pennsylvania ................................... 4 — 4 —
South Carolina .................................. 1 — 1 —
Texas ......................................... 12 1 9 2
Virginia ....................................... 4 2 2 —
Total .......................................... 104 9 76 19
Store count activity for the year ended January 29, 2011 was as follows:
SFA
OFF
5TH Total
Store count as of January 30, 2010 ............................................... 53 55 108
New stores opened ........................................................ — 4 4
Stores closed ............................................................ (6) (2) (8)
Store count as of January 29, 2011 ............................................... 47 57 104
14