Saks Fifth Avenue 2010 Annual Report Download - page 59
Download and view the complete annual report
Please find page 59 of the 2010 Saks Fifth Avenue annual report below. You can navigate through the pages in the report by either clicking on the pages listed below, or by using the keyword search tool below to find specific information within the annual report.-
 1
1 -
2
-
3
-
4
-
5
-
6
-
7
-
8
-
9
-
10
-
11
-
12
-
13
-
14
-
15
-
16
-
17
-
18
-
19
-
20
-
21
-
22
-
23
-
24
-
25
-
26
-
27
-
28
-
29
-
30
-
31
-
32
-
33
-
34
-
35
-
36
-
37
-
38
-
39
-
40
-
41
-
42
-
43
-
44
-
45
-
46
-
47
-
48
-
 49
49 -
 50
50 -
 51
51 -
 52
52 -
 53
53 -
 54
54 -
 55
55 -
 56
56 -
 57
57 -
 58
58 -
 59
59 -
 60
60 -
 61
61 -
 62
62 -
 63
63 -
 64
64 -
 65
65 -
 66
66 -
 67
67 -
 68
68 -
 69
69 -
70
-
71
-
72
-
73
-
74
-
75
-
76
-
77
-
78
-
79
-
80
-
81
-
82
-
83
-
84
-
85
-
86
-
87
-
88
-
89
-
90
-
91
-
92
-
93
-
94
-
95
-
96
-
97
-
98
-
99
-
100
-
101
-
102
-
103
-
104
-
105
-
106
-
107
-
108
-
109
-
110
-
111
-
112
-
113
-
114
-
115
-
116
-
117
-
118
-
119
-
120
-
121
-
122
-
123
-
124
-
125
-
126
-
127
-
128
-
129
-
130
-
131
-
132
-
133
 |
 |
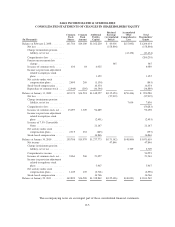
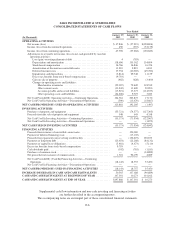
SAKS INCORPORATED & SUBSIDIARIES
NOTES TO CONSOLIDATED FINANCIAL STATEMENTS—(Continued)
(In thousands, except per share amounts)
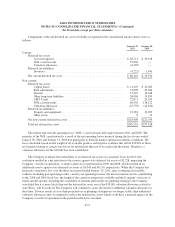
The Company estimates the amount of goods that will be returned for a refund and reduces sales and gross
margin by that amount.
Commissions from leased departments included in net sales were $31,832, $27,180, and $28,083 in 2010,
2009, and 2008, respectively. Leased department sales were $233,442, $200,535, and $210,284 in 2010, 2009,
and 2008, respectively, and were excluded from net sales.
CASH AND CASH EQUIVALENTS
Cash and cash equivalents primarily consist of cash on hand in the stores, deposits with banks, and
investments with banks and financial institutions that have original maturities of three months or less. Cash
equivalents are stated at cost, which approximates fair value. Cash equivalents totaled $190,007 and $136,347 as
of January 29, 2011 and January 30, 2010, respectively, primarily consisting of money market funds, demand
deposits, and time deposits. Income earned on cash equivalents was $551, $36, and $1,943 for the fiscal years
ended January 29, 2011, January 30, 2010, and January 31, 2009, respectively, and was reflected in Other Income
in the accompanying Consolidated Statements of Income. As of January 29, 2011 and January 30, 2010, the
Company had a compensating balance of $10,000 and $20,000, respectively, related to the Company’s
purchasing card program to ensure future credit availability under that program.
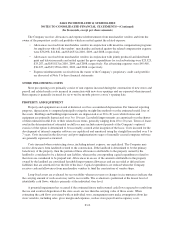
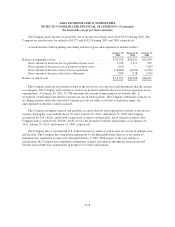
MERCHANDISE INVENTORIES AND COST OF SALES
Merchandise inventories are stated at the lower of cost or market. Cost is determined using the retail
“first-in, first-out” (FIFO) method and includes freight, buying and distribution costs. The Company takes
markdowns related to slow moving inventory, ensuring the appropriate inventory valuation.
The Company regularly records a provision for estimated shrinkage, thereby reducing the carrying value of
merchandise inventory. A complete physical inventory of all the Company’s stores and distribution facilities is
performed annually, with the recorded amount of merchandise inventory being adjusted to coincide with this
physical count. The differences between the estimated amount of shrinkage and the actual amount realized have
been insignificant.
The Company receives vendor provided support in different forms. When the vendor provides support for
inventory markdowns, the Company records the support as a reduction to cost of sales. Such support is recorded
in the period that the corresponding markdowns are taken. When the Company receives inventory-related support
that is not designated for markdowns, the Company includes this support as a reduction in the cost of purchases.
Consignment merchandise on hand of $109,877 and $142,928 as of January 29, 2011 and January 30, 2010,
respectively, is not reflected in the consolidated balance sheets.
SELLING, GENERAL AND ADMINISTRATIVE EXPENSES (“SG&A”)
SG&A expenses are comprised principally of the costs related to employee compensation and benefits in the
selling and administrative support areas; advertising; operating and maintenance costs; proprietary credit card
promotion, issuance and servicing costs; insurance programs; telecommunications; shipping and handling costs;
and other operating expenses not specifically categorized elsewhere in the Consolidated Statements of Income.
Payroll taxes, rent, depreciation, and property taxes are not included in SG&A.
Advertising and sales promotion costs are expensed in the period in which the advertising event takes place.
F-9