Saks Fifth Avenue 2010 Annual Report Download - page 17
Download and view the complete annual report
Please find page 17 of the 2010 Saks Fifth Avenue annual report below. You can navigate through the pages in the report by either clicking on the pages listed below, or by using the keyword search tool below to find specific information within the annual report.-
 1
1 -
2
-
3
-
4
-
5
-
6
-
 7
7 -
 8
8 -
 9
9 -
 10
10 -
 11
11 -
 12
12 -
 13
13 -
 14
14 -
 15
15 -
 16
16 -
 17
17 -
 18
18 -
 19
19 -
 20
20 -
 21
21 -
 22
22 -
 23
23 -
 24
24 -
 25
25 -
 26
26 -
 27
27 -
28
-
29
-
30
-
31
-
32
-
33
-
34
-
35
-
36
-
37
-
38
-
39
-
40
-
41
-
42
-
43
-
44
-
45
-
46
-
47
-
48
-
49
-
50
-
51
-
52
-
53
-
54
-
55
-
56
-
57
-
58
-
59
-
60
-
61
-
62
-
63
-
64
-
65
-
66
-
67
-
68
-
69
-
70
-
71
-
72
-
73
-
74
-
75
-
76
-
77
-
78
-
79
-
80
-
81
-
82
-
83
-
84
-
85
-
86
-
87
-
88
-
89
-
90
-
91
-
92
-
93
-
94
-
95
-
96
-
97
-
98
-
99
-
100
-
101
-
102
-
103
-
104
-
105
-
106
-
107
-
108
-
109
-
110
-
111
-
112
-
113
-
114
-
115
-
116
-
117
-
118
-
119
-
120
-
121
-
122
-
123
-
124
-
125
-
126
-
127
-
128
-
129
-
130
-
131
-
132
-
133
 |
 |
PART II
Item 5. Market for Registrant’s Common Equity, Related Stockholder Matters and Issuer Purchases of
Equity Securities.
Market Information
The Company’s common stock trades on the NYSE under the symbol SKS. The prices in the table below
represent the high and low sales prices for the stock as reported by the NYSE.
Year Ended
January 29, 2011
Year Ended
January 30, 2010
High Low High Low
First Quarter ................................ $10.65 $ 6.14 $5.40 $1.50
Second Quarter .............................. $10.37 $ 7.06 $5.54 $3.25
Third Quarter ................................ $11.49 $ 6.60 $7.45 $5.11
Fourth Quarter ............................... $12.22 $10.52 $7.72 $5.37
Holders
As of March 11, 2011, there were approximately 2,285 shareholders of record of the Company’s common
stock.
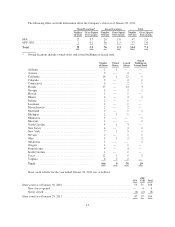
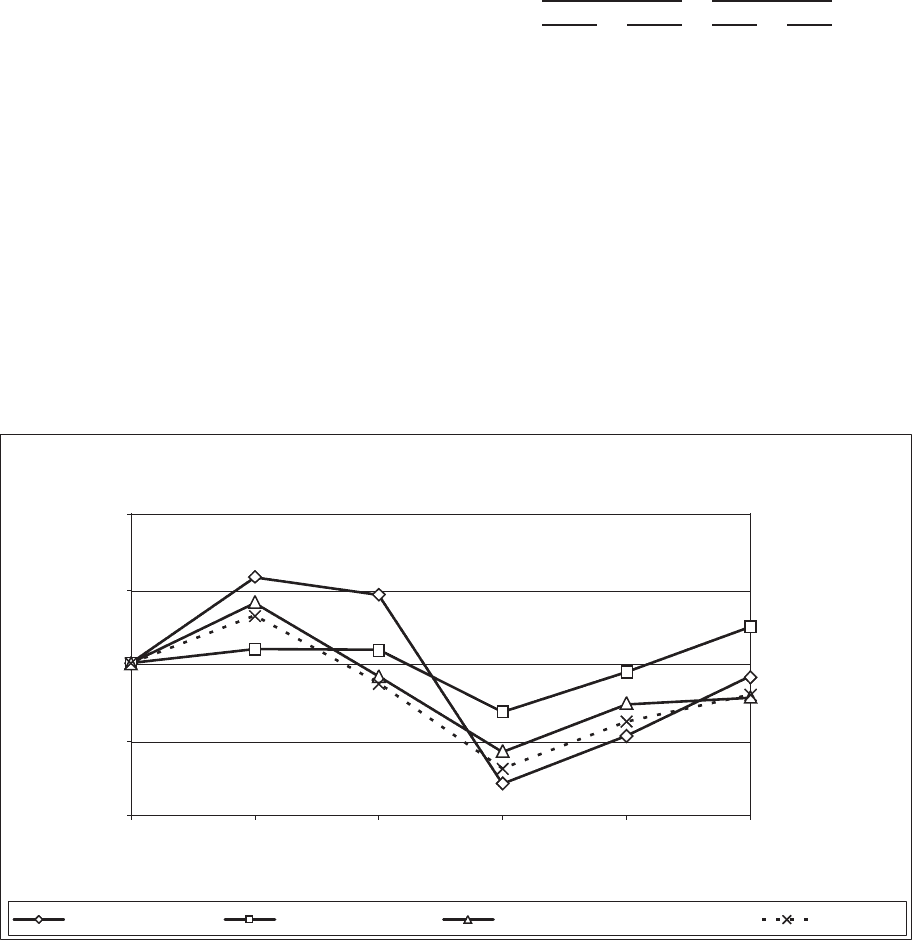
Performance Graph
The following graph and table compare cumulative total shareholder return among the Company, the S&P
Midcap 400 Index, the S&P 500 Department Stores Index, and a Retail Peer Group Index (weighted by market
capitalization and consisting of Dillard’s, Inc.; Macy’s, Inc.; Nordstrom, Inc.; and J.C. Penney Company, Inc.)
assuming an initial investment of $100 and reinvestment of dividends.
COMPARISON OF CUMULATIVE FIVE YEAR TOTAL RETURN
SAKS INCORPORATED S&P MIDCAP 400 INDEX S&P 500 DEPARTMENT STORES INDEX PEER GROUP
2/3/071/28/06 2/2/08 1/31/09 1/29/111/30/10
$0
$50
$100
$150
$200
16