Quest Diagnostics 2010 Annual Report Download - page 83
Download and view the complete annual report
Please find page 83 of the 2010 Quest Diagnostics annual report below. You can navigate through the pages in the report by either clicking on the pages listed below, or by using the keyword search tool below to find specific information within the annual report.-
 1
1 -
2
-
3
-
4
-
5
-
6
-
7
-
8
-
9
-
10
-
11
-
12
-
13
-
14
-
15
-
16
-
17
-
18
-
19
-
20
-
21
-
22
-
23
-
24
-
25
-
26
-
27
-
28
-
29
-
30
-
31
-
32
-
33
-
34
-
35
-
36
-
37
-
38
-
39
-
40
-
41
-
42
-
43
-
44
-
45
-
46
-
47
-
48
-
49
-
50
-
51
-
52
-
53
-
54
-
55
-
56
-
57
-
58
-
59
-
60
-
61
-
62
-
63
-
64
-
65
-
66
-
67
-
68
-
69
-
70
-
71
-
72
-
 73
73 -
 74
74 -
 75
75 -
 76
76 -
 77
77 -
 78
78 -
 79
79 -
 80
80 -
 81
81 -
 82
82 -
 83
83 -
 84
84 -
 85
85 -
 86
86 -
 87
87 -
 88
88 -
 89
89 -
 90
90 -
 91
91 -
 92
92 -
 93
93 -
94
-
95
-
96
-
97
-
98
-
99
-
100
-
101
-
102
-
103
-
104
-
105
-
106
-
107
-
108
-
109
-
110
-
111
-
112
-
113
-
114
 |
 |

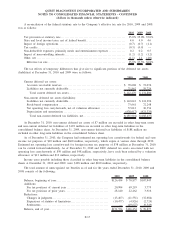
A reconciliation of the federal statutory rate to the Company’s effective tax rate for 2010, 2009 and 2008
was as follows:
2010 2009 2008
Tax provision at statutory rate ................................................... 35.0% 35.0% 35.0%
State and local income taxes, net of federal benefit . . ............................. 4.0 4.0 4.6
Impact of foreign operations..................................................... (0.7) (0.7) (1.1)
Tax credits ..................................................................... (0.3) (0.9) —
Non-deductible expenses, primarily meals and entertainment expenses . . ........... 0.2 0.2 0.5
Impact of noncontrolling interests. ............................................... (1.2) (1.2) (1.2)
Other, net ...................................................................... (1.1) 1.1 (1.0)
Effective tax rate ............................................................. 35.9% 37.5% 36.8%
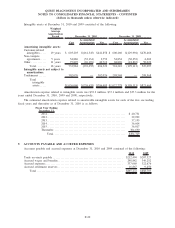
The tax effects of temporary differences that give rise to significant portions of the deferred tax assets
(liabilities) at December 31, 2010 and 2009 were as follows:
2010 2009
Current deferred tax assets:
Accounts receivable reserves. . . ............................................ $ 70,608 $ 72,076
Liabilities not currently deductible ......................................... 71,862 59,724
Total current deferred tax assets ......................................... $ 142,470 $ 131,800
Non-current deferred tax assets (liabilities):
Liabilities not currently deductible ......................................... $ 142,043 $ 124,296
Stock-based compensation ................................................. 73,661 72,248
Net operating loss carryforwards, net of valuation allowance ................ 37,012 36,354
Depreciation and amortization . ............................................ (438,617) (421,335)
Total non-current deferred tax liabilities, net . . . .......................... $(185,901) $(188,437)
At December 31, 2010, non-current deferred tax assets of $7 million are recorded in other long-term assets
and non-current deferred tax liabilities of $193 million are recorded in other long-term liabilities in the
consolidated balance sheet. At December 31, 2009, non-current deferred tax liabilities of $188 million are
included in other long-term liabilities in the consolidated balance sheet.
As of December 31, 2010, the Company had estimated net operating loss carryforwards for federal and state
income tax purposes of $10 million and $660 million, respectively, which expire at various dates through 2030.
Estimated net operating loss carryforwards for foreign income tax purposes of $38 million at December 31, 2010
can be carried forward indefinitely. As of December 31, 2010 and 2009, deferred tax assets associated with net
operating loss carryforwards of $50 million and $48 million, respectively, have each been reduced by a valuation
allowance of $13 million and $12 million, respectively.
Income taxes payable including those classified in other long-term liabilities in the consolidated balance
sheets at December 31, 2010 and 2009, were $128 million and $100 million, respectively.
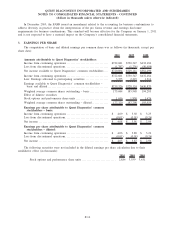
The total amount of unrecognized tax benefits as of and for the years ended December 31, 2010, 2009 and
2008 consists of the following:
2010 2009 2008
Balance, beginning of year . . . ...................................... $126,454 $ 70,877 $107,943
Additions:
For tax positions of current year ................................. 20,904 69,219 3,775
For tax positions of prior years .................................. 28,140 22,462 3,916
Reductions:
Changes in judgment ............................................ (13,467) (11,551) (32,684)
Expirations of statutes of limitations. . ............................ (10,477) (4,926) (2,724)
Settlements ..................................................... — (19,627) (9,349)
Balance, end of year............................................... $151,554 $126,454 $ 70,877
F-17
QUEST DIAGNOSTICS INCORPORATED AND SUBSIDIARIES
NOTES TO CONSOLIDATED FINANCIAL STATEMENTS - CONTINUED
(dollars in thousands unless otherwise indicated)