Quest Diagnostics 2010 Annual Report Download - page 104
Download and view the complete annual report
Please find page 104 of the 2010 Quest Diagnostics annual report below. You can navigate through the pages in the report by either clicking on the pages listed below, or by using the keyword search tool below to find specific information within the annual report.-
 1
1 -
2
-
3
-
4
-
5
-
6
-
7
-
8
-
9
-
10
-
11
-
12
-
13
-
14
-
15
-
16
-
17
-
18
-
19
-
20
-
21
-
22
-
23
-
24
-
25
-
26
-
27
-
28
-
29
-
30
-
31
-
32
-
33
-
34
-
35
-
36
-
37
-
38
-
39
-
40
-
41
-
42
-
43
-
44
-
45
-
46
-
47
-
48
-
49
-
50
-
51
-
52
-
53
-
54
-
55
-
56
-
57
-
58
-
59
-
60
-
61
-
62
-
63
-
64
-
65
-
66
-
67
-
68
-
69
-
70
-
71
-
72
-
73
-
74
-
75
-
76
-
77
-
78
-
79
-
80
-
81
-
82
-
83
-
84
-
85
-
86
-
87
-
88
-
89
-
90
-
91
-
92
-
93
-
 94
94 -
 95
95 -
 96
96 -
 97
97 -
 98
98 -
 99
99 -
 100
100 -
 101
101 -
 102
102 -
 103
103 -
 104
104 -
 105
105 -
 106
106 -
 107
107 -
 108
108 -
 109
109 -
 110
110 -
 111
111 -
 112
112 -
 113
113 -
 114
114
 |
 |

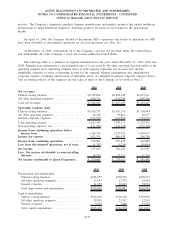
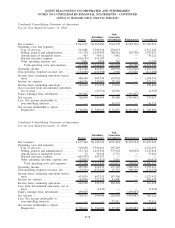
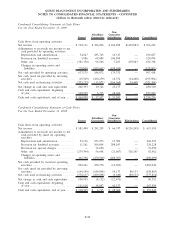
Condensed Consolidating Statement of Operations
For the Year Ended December 31, 2010
Parent
Subsidiary
Guarantors
Non-
Guarantor
Subsidiaries Eliminations Consolidated
Net revenues ................................ $ 841,637 $6,065,086 $744,798 $(282,596) $7,368,925
Operating costs and expenses:
Cost of services........................... 511,886 3,550,726 254,635 — 4,317,247
Selling, general and administrative ......... 111,530 1,245,050 380,861 (29,768) 1,707,673
Amortization of intangible assets........... 967 30,412 7,842 — 39,221
Royalty (income) expense . . . .............. (414,185) 414,185 — — —
Other operating expense, net. .............. 7,691 1,056 502 — 9,249
Total operating costs and expenses . ..... 217,889 5,241,429 643,840 (29,768) 6,073,390
Operating income ........................... 623,748 823,657 100,958 (252,828) 1,295,535
Non-operating (expense) income, net ......... (134,080) (232,908) 2,960 252,828 (111,200)
Income from continuing operations before
taxes ..................................... 489,668 590,749 103,918 — 1,184,335
Income tax expense . . ....................... 164,176 233,091 28,264 — 425,531
Income from continuing operations ........... 325,492 357,658 75,654 — 758,804
(Loss) income from discontinued operations,
net of taxes............................... — (16,713) 14,926 — (1,787)
Equity earnings from subsidiaries ............ 395,402 — — (395,402) —
Net income ................................. 720,894 340,945 90,580 (395,402) 757,017
Less: Net income attributable to
noncontrolling interests .................... — — 36,123 — 36,123
Net income attributable to Quest
Diagnostics ............................... $ 720,894 $ 340,945 $ 54,457 $(395,402) $ 720,894
Condensed Consolidating Statement of Operations
For the Year Ended December 31, 2009
Parent
Subsidiary
Guarantors
Non-
Guarantor
Subsidiaries Eliminations Consolidated
Net revenues ................................ $ 877,940 $6,140,346 $767,481 $(330,524) $7,455,243
Operating costs and expenses:
Cost of services........................... 518,958 3,550,414 252,103 — 4,321,475
Selling, general and administrative ......... 171,724 1,232,366 373,542 (30,014) 1,747,618
Amortization of intangible assets........... 72 30,218 6,772 — 37,062
Royalty (income) expense . . . .............. (405,393) 405,393 — — —
Other operating (income) expense, net ..... (13,017) (521) 3,515 — (10,023)
Total operating costs and expenses . ..... 272,344 5,217,870 635,932 (30,014) 6,096,132
Operating income ........................... 605,596 922,476 131,549 (300,510) 1,359,111
Non-operating (expense) income, net ......... (172,522) (274,924) 15,757 300,510 (131,179)
Income from continuing operations before
taxes ..................................... 433,074 647,552 147,306 — 1,227,932
Income tax expense . . ....................... 163,846 252,220 44,408 — 460,474
Income from continuing operations ........... 269,228 395,332 102,898 — 767,458
Loss from discontinued operations, net of
taxes ..................................... — (1,236) — — (1,236)
Equity earnings from subsidiaries ............ 459,883 — — (459,883) —
Net income ................................. 729,111 394,096 102,898 (459,883) 766,222
Less: Net income attributable to
noncontrolling interests .................... — — 37,111 — 37,111
Net income attributable to Quest
Diagnostics ............................... $ 729,111 $ 394,096 $ 65,787 $(459,883) $ 729,111
F-38
QUEST DIAGNOSTICS INCORPORATED AND SUBSIDIARIES
NOTES TO CONSOLIDATED FINANCIAL STATEMENTS - CONTINUED
(dollars in thousands unless otherwise indicated)