Quest Diagnostics 2010 Annual Report Download - page 63
Download and view the complete annual report
Please find page 63 of the 2010 Quest Diagnostics annual report below. You can navigate through the pages in the report by either clicking on the pages listed below, or by using the keyword search tool below to find specific information within the annual report.-
 1
1 -
2
-
3
-
4
-
5
-
6
-
7
-
8
-
9
-
10
-
11
-
12
-
13
-
14
-
15
-
16
-
17
-
18
-
19
-
20
-
21
-
22
-
23
-
24
-
25
-
26
-
27
-
28
-
29
-
30
-
31
-
32
-
33
-
34
-
35
-
36
-
37
-
38
-
39
-
40
-
41
-
42
-
43
-
44
-
45
-
46
-
47
-
48
-
49
-
50
-
51
-
52
-
 53
53 -
 54
54 -
 55
55 -
 56
56 -
 57
57 -
 58
58 -
 59
59 -
 60
60 -
 61
61 -
 62
62 -
 63
63 -
 64
64 -
 65
65 -
 66
66 -
 67
67 -
 68
68 -
 69
69 -
 70
70 -
 71
71 -
 72
72 -
 73
73 -
74
-
75
-
76
-
77
-
78
-
79
-
80
-
81
-
82
-
83
-
84
-
85
-
86
-
87
-
88
-
89
-
90
-
91
-
92
-
93
-
94
-
95
-
96
-
97
-
98
-
99
-
100
-
101
-
102
-
103
-
104
-
105
-
106
-
107
-
108
-
109
-
110
-
111
-
112
-
113
-
114
 |
 |

Dividends
During each of the quarters of 2010 and 2009, our Board of Directors declared a quarterly cash dividend of
$0.10 per common share. We expect to fund future dividend payments with cash flows from operations, and do
not expect the dividend to have a material impact on our ability to finance future growth.
Share Repurchases
For the year ended December 31, 2010, we repurchased 14.7 million shares of our common stock at an
average price of $51.04 per share for $750 million, including 4.5 million shares purchased in the first quarter at
an average price of $56.21 per share for $251 million under an accelerated share repurchase transaction with a
bank. For the year ended December 31, 2009, we repurchased 10 million shares of our common stock at an
average price of $49.83 per share for $500 million, including 4.5 million shares repurchased from SB Holdings
Capital Inc., a wholly-owned subsidiary of GlaxoSmithKline plc. (“GSK”), at an average price of $44.33 per
share for $200 million. For the years ended December 31, 2010 and 2009, we reissued 2.1 million shares and 3.0
million shares, respectively, for employee benefit plans. Since the inception of our share repurchase program in
May 2003, we have repurchased approximately 74 million shares of our common stock at an average price of
$47.13 for $3.5 billion. At December 31, 2010, $250 million of our share repurchase authorization remained
available. In January 2011, our Board of Directors authorized $750 million of additional share repurchases,
bringing the total available under share repurchase authorizations, which have no set expiration or termination
date, to $1 billion.
On January 31, 2011, we agreed to repurchase 15.4 million shares of our common stock from SB Holdings
Capital Inc., an affiliate of GSK, at a purchase price of $54.30 per share for $835 million (the “Repurchase”).
We funded the Repurchase, which closed on February 4, 2011, with $260 million of cash on-hand, $500 million
of borrowings under our secured receivables credit facility and $75 million of borrowings under our senior
unsecured revolving credit facility. Subsequent to the Repurchase, our remaining share repurchase authorization
totaled $165 million.
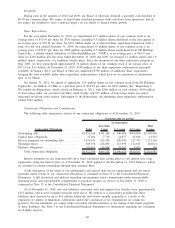
Contractual Obligations and Commitments
The following table summarizes certain of our contractual obligations as of December 31, 2010.
Contractual Obligations Total
Less than
1 year 1–3 years 3–5 years
After
5 years
(in thousands)
Payments due by period
Outstanding debt................................ $2,951,268 $341,268 $ 560,000 $500,000 $1,550,000
Capital lease obligations......................... 47,184 7,736 14,877 11,016 13,555
Interest payments on outstanding debt............ 1,676,941 126,786 220,046 217,743 1,112,366
Operating leases ................................ 645,358 174,094 217,939 112,651 140,674
Purchase obligations . . . ......................... 91,613 49,444 33,162 8,621 386
Total contractual obligations ................ $5,412,364 $699,328 $1,046,024 $850,031 $2,816,981
Interest payments on our long-term debt have been calculated after giving effect to our interest rate swap
agreements, using the interest rates as of December 31, 2010 applied to the December 31, 2010 balances, which
are assumed to remain outstanding through their maturity dates.
A full description of the terms of our indebtedness and related debt service requirements and our future
payments under certain of our contractual obligations is contained in Note 10 to the Consolidated Financial
Statements. A full discussion and analysis regarding our minimum rental commitments under noncancelable
operating leases and noncancelable commitments to purchase product or services at December 31, 2010 is
contained in Note 15 to the Consolidated Financial Statements.
As of December 31, 2010, our total liabilities associated with unrecognized tax benefits were approximately
$152 million, which were excluded from the table above. We believe it is reasonably possible that these
liabilities may decrease by up to $14 million within the next twelve months, primarily as a result of the
expiration of statutes of limitations, settlements and/or the conclusion of tax examinations on certain tax
positions. For the remainder, we cannot make reasonably reliable estimates of the timing of the future payments
of these liabilities. See Note 5 to the Consolidated Financial Statements for information regarding our contingent
tax liability reserves.
60