Quest Diagnostics 2010 Annual Report Download - page 54
Download and view the complete annual report
Please find page 54 of the 2010 Quest Diagnostics annual report below. You can navigate through the pages in the report by either clicking on the pages listed below, or by using the keyword search tool below to find specific information within the annual report.-
 1
1 -
2
-
3
-
4
-
5
-
6
-
7
-
8
-
9
-
10
-
11
-
12
-
13
-
14
-
15
-
16
-
17
-
18
-
19
-
20
-
21
-
22
-
23
-
24
-
25
-
26
-
27
-
28
-
29
-
30
-
31
-
32
-
33
-
34
-
35
-
36
-
37
-
38
-
39
-
40
-
41
-
42
-
43
-
 44
44 -
 45
45 -
 46
46 -
 47
47 -
 48
48 -
 49
49 -
 50
50 -
 51
51 -
 52
52 -
 53
53 -
 54
54 -
 55
55 -
 56
56 -
 57
57 -
 58
58 -
 59
59 -
 60
60 -
 61
61 -
 62
62 -
 63
63 -
 64
64 -
65
-
66
-
67
-
68
-
69
-
70
-
71
-
72
-
73
-
74
-
75
-
76
-
77
-
78
-
79
-
80
-
81
-
82
-
83
-
84
-
85
-
86
-
87
-
88
-
89
-
90
-
91
-
92
-
93
-
94
-
95
-
96
-
97
-
98
-
99
-
100
-
101
-
102
-
103
-
104
-
105
-
106
-
107
-
108
-
109
-
110
-
111
-
112
-
113
-
114
 |
 |

Net Revenues
The decrease in net revenues from the prior year was principally related to lower revenues from our clinical
testing business. For the year ended December 31, 2010, revenues from our clinical testing business, which
accounts for over 90% of our net revenues, were 1.3% below the prior year level.
Clinical testing volume, measured by the number of requisitions, decreased 1.0%. We believe that clinical
testing volume was adversely affected by a general slowdown in physician office visits compared to the prior
year, and severe weather in the first quarter of 2010. Published survey data estimates that physician office visits
declined approximately 5% in 2010 compared to 2009.
Revenue per requisition decreased 0.2% for the year ended December 31, 2010. Revenue per requisition
benefitted from an increased mix of gene-based and esoteric testing and an increase in the number of tests
ordered per requisition. Offsetting these benefits were a 1.9% Medicare fee schedule decrease, which went into
effect on January 1, 2010 and served to reduce revenue per requisition by 0.4%; business and payer mix changes,
including an increase in lower priced drugs-of-abuse testing and a decrease in higher priced anatomic pathology
testing; and pricing changes in connection with several large contract extensions entered into in 2009 and in the
first half of 2010.
Our businesses other than clinical laboratory testing accounted for approximately 9% of our net revenues in
2010 and 2009. These businesses contain most of our international operations and include our risk assessment
services, clinical trials testing, healthcare information technology, and diagnostic products businesses. For the year
ended December 31, 2010, aggregate revenues for these businesses approximated the prior year level.
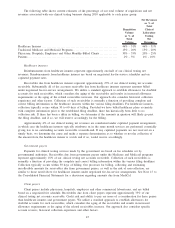
Operating Costs and Expenses
$
% Net
Revenues $
% Net
Revenues $
% Net
Revenues
2010 2009
Change
Increase (decrease)
(dollars in millions)
Cost of services . .............................. $4,317.2 58.6% $4,321.5 58.0% $ (4.3) 0.6%
Selling, general and administrative expenses
(SG&A) .................................... 1,707.7 23.2% 1,747.6 23.4% (39.9) (0.2)%
Amortization of intangible assets ............... 39.2 0.5% 37.0 0.5% 2.2 —
Other operating expense (income), net .......... 9.3 0.1% (10.0) (0.1)% 19.3 0.2%
Total operating costs and expenses . . ........... $6,073.4 82.4% $6,096.1 81.8% $(22.7) 0.6%
Bad debt expense (included in SG&A) ......... $ 291.7 4.0% $ 321.0 4.3% $(29.3) (0.3)%
Total Operating Costs and Expenses
Lower revenues in our clinical testing business, including the impact of severe weather in the first quarter of
2010, and charges associated with actions we have taken to adjust our cost structure, partially offset by reduced
costs for performance-based compensation, improved experience associated with professional liability claims and
continued progress in reducing bad debt expense, served to increase total operating costs as a percentage of net
revenues for the year ended December 31, 2010. During the year ended December 31, 2010, we recorded $27.0
million of pre-tax charges, principally associated with workforce reductions, of which $6.4 million was recorded
in cost of services and $20.6 million was recorded in selling, general and administrative expenses. Operating
costs for the year ended December 31, 2010 also included a $9.6 million fourth quarter charge associated with
the settlement of employee litigation.
Operating costs for the year ended December 31, 2009 included a $15.5 million gain related to an insurance
settlement for storm related losses, which served to decrease total operating costs as a percentage of net revenues
for the year ended December 31, 2009.
Also, year-over-year comparisons for the year ended December 31, 2010 were favorably impacted by $2.7
million associated with gains and losses on investments in our supplemental deferred compensation plans. The
impact can fluctuate significantly from year to year based on investment performance. Under our supplemental
deferred compensation plans, employee compensation deferrals, together with Company matching contributions,
are invested in a variety of investments held in trusts. Gains and losses associated with the investments are
recorded in earnings within other income (expense), net. A corresponding and offsetting adjustment is also
recorded to the deferred compensation obligation to reflect investment gains and losses earned by employees.
51