Quest Diagnostics 2010 Annual Report Download - page 105
Download and view the complete annual report
Please find page 105 of the 2010 Quest Diagnostics annual report below. You can navigate through the pages in the report by either clicking on the pages listed below, or by using the keyword search tool below to find specific information within the annual report.-
 1
1 -
2
-
3
-
4
-
5
-
6
-
7
-
8
-
9
-
10
-
11
-
12
-
13
-
14
-
15
-
16
-
17
-
18
-
19
-
20
-
21
-
22
-
23
-
24
-
25
-
26
-
27
-
28
-
29
-
30
-
31
-
32
-
33
-
34
-
35
-
36
-
37
-
38
-
39
-
40
-
41
-
42
-
43
-
44
-
45
-
46
-
47
-
48
-
49
-
50
-
51
-
52
-
53
-
54
-
55
-
56
-
57
-
58
-
59
-
60
-
61
-
62
-
63
-
64
-
65
-
66
-
67
-
68
-
69
-
70
-
71
-
72
-
73
-
74
-
75
-
76
-
77
-
78
-
79
-
80
-
81
-
82
-
83
-
84
-
85
-
86
-
87
-
88
-
89
-
90
-
91
-
92
-
93
-
94
-
 95
95 -
 96
96 -
 97
97 -
 98
98 -
 99
99 -
 100
100 -
 101
101 -
 102
102 -
 103
103 -
 104
104 -
 105
105 -
 106
106 -
 107
107 -
 108
108 -
 109
109 -
 110
110 -
 111
111 -
 112
112 -
 113
113 -
 114
114
 |
 |

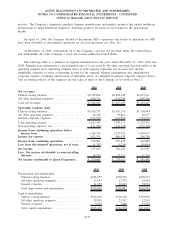
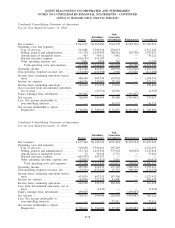
Condensed Consolidating Statement of Operations
For the Year Ended December 31, 2008
Parent
Subsidiary
Guarantors
Non-
Guarantor
Subsidiaries Eliminations Consolidated
Net revenues ................................ $ 829,484 $5,999,552 $653,183 $(232,772) $7,249,447
Operating costs and expenses:
Cost of services........................... 486,922 3,527,559 241,675 — 4,256,156
Selling, general and administrative ......... 191,583 1,234,815 334,772 (24,236) 1,736,934
Amortization of intangible assets........... 268 30,857 6,168 — 37,293
Royalty (income) expense . . . .............. (424,404) 424,404 — — —
Other operating expense (income), net ..... 404 (511) (3,205) — (3,312)
Total operating costs and expenses . ..... 254,773 5,217,124 579,410 (24,236) 6,027,071
Operating income ........................... 574,711 782,428 73,773 (208,536) 1,222,376
Non-operating (expense) income, net ......... (188,720) (198,595) 7,060 208,536 (171,719)
Income from continuing operations before
taxes ..................................... 385,991 583,833 80,833 — 1,050,657
Income tax expense . . ....................... 130,746 237,119 18,903 — 386,768
Income from continuing operations ........... 255,245 346,714 61,930 — 663,889
(Loss) income from discontinued operations,
net of taxes............................... — (55,511) 4,817 — (50,694)
Equity earnings from subsidiaries ............ 326,245 — — (326,245) —
Net income ................................. 581,490 291,203 66,747 (326,245) 613,195
Less: Net income attributable to
noncontrolling interests .................... — — 31,705 — 31,705
Net income attributable to Quest
Diagnostics ............................... $ 581,490 $ 291,203 $ 35,042 $(326,245) $ 581,490
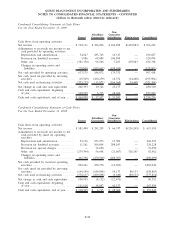
Condensed Consolidating Statement of Cash Flows
For the Year Ended December 31, 2010
Parent
Subsidiary
Guarantors
Non-
Guarantor
Subsidiaries Eliminations Consolidated
Cash flows from operating activities:
Net income ................................. $ 720,894 $ 340,945 $ 90,580 $(395,402) $ 757,017
Adjustments to reconcile net income to net
cash provided by operating activities:
Depreciation and amortization ............. 49,310 188,705 15,949 — 253,964
Provision for doubtful accounts ............ 5,164 55,240 231,333 — 291,737
Other, net ................................ (352,975) 13,547 1,158 395,402 57,132
Changes in operating assets and liabilities . . 450,897 (474,476) (218,224) — (241,803)
Net cash provided by operating activities ..... 873,290 123,961 120,796 — 1,118,047
Net cash used in investing activities.......... (120) (144,863) (7,725) (63,802) (216,510)
Net cash (used in) provided by financing
activities. ................................. (945,603) 4,373 (109,064) 63,802 (986,492)
Net change in cash and cash equivalents ..... (72,433) (16,529) 4,007 — (84,955)
Cash and cash equivalents, beginning
of year . . ................................. 464,958 17,457 51,841 — 534,256
Cash and cash equivalents, end of year. ...... $ 392,525 $ 928 $ 55,848 $ — $ 449,301
F-39
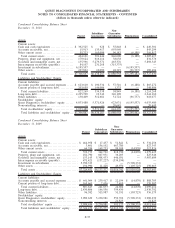
QUEST DIAGNOSTICS INCORPORATED AND SUBSIDIARIES
NOTES TO CONSOLIDATED FINANCIAL STATEMENTS - CONTINUED
(dollars in thousands unless otherwise indicated)