Quest Diagnostics 2010 Annual Report Download - page 106
Download and view the complete annual report
Please find page 106 of the 2010 Quest Diagnostics annual report below. You can navigate through the pages in the report by either clicking on the pages listed below, or by using the keyword search tool below to find specific information within the annual report.-
 1
1 -
2
-
3
-
4
-
5
-
6
-
7
-
8
-
9
-
10
-
11
-
12
-
13
-
14
-
15
-
16
-
17
-
18
-
19
-
20
-
21
-
22
-
23
-
24
-
25
-
26
-
27
-
28
-
29
-
30
-
31
-
32
-
33
-
34
-
35
-
36
-
37
-
38
-
39
-
40
-
41
-
42
-
43
-
44
-
45
-
46
-
47
-
48
-
49
-
50
-
51
-
52
-
53
-
54
-
55
-
56
-
57
-
58
-
59
-
60
-
61
-
62
-
63
-
64
-
65
-
66
-
67
-
68
-
69
-
70
-
71
-
72
-
73
-
74
-
75
-
76
-
77
-
78
-
79
-
80
-
81
-
82
-
83
-
84
-
85
-
86
-
87
-
88
-
89
-
90
-
91
-
92
-
93
-
94
-
95
-
 96
96 -
 97
97 -
 98
98 -
 99
99 -
 100
100 -
 101
101 -
 102
102 -
 103
103 -
 104
104 -
 105
105 -
 106
106 -
 107
107 -
 108
108 -
 109
109 -
 110
110 -
 111
111 -
 112
112 -
 113
113 -
 114
114
 |
 |

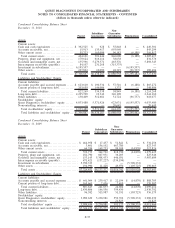
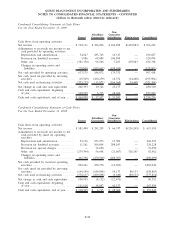
Condensed Consolidating Statement of Cash Flows
For the Year Ended December 31, 2009
Parent
Subsidiary
Guarantors
Non-
Guarantor
Subsidiaries Eliminations Consolidated
Cash flows from operating activities:
Net income ................................. $ 729,111 $ 394,096 $ 102,898 $(459,883) $ 766,222
Adjustments to reconcile net income to net
cash provided by operating activities:
Depreciation and amortization ............. 54,627 185,743 16,317 — 256,687
Provision for doubtful accounts ............ 5,986 68,089 246,899 — 320,974
Other, net ................................ (381,358) 96,546 7,267 459,883 182,338
Changes in operating assets and
liabilities ............................... 228,809 (559,602) (198,010) — (528,803)
Net cash provided by operating activities ..... 637,175 184,872 175,371 — 997,418
Net cash (used in) provided by investing
activities. ................................. (15,549) (160,259) 14,372 (34,468) (195,904)
Net cash used in financing activities . . . ...... (375,233) (13,871) (166,568) 34,468 (521,204)
Net change in cash and cash equivalents ..... 246,393 10,742 23,175 — 280,310
Cash and cash equivalents, beginning
of year . . ................................. 218,565 6,715 28,666 — 253,946
Cash and cash equivalents, end of year. ...... $ 464,958 $ 17,457 $ 51,841 $ — $ 534,256
Condensed Consolidating Statement of Cash Flows
For the Year Ended December 31, 2008
Parent
Subsidiary
Guarantors
Non-
Guarantor
Subsidiaries Eliminations Consolidated
Cash flows from operating activities:
Net income ................................. $ 581,490 $ 291,203 $ 66,747 $(326,245) $ 613,195
Adjustments to reconcile net income to net
cash provided by (used in) operating
activities:
Depreciation and amortization ............. 53,116 193,975 17,502 — 264,593
Provision for doubtful accounts ............ 11,261 106,804 208,163 — 326,228
Provision for special charges .............. — 72,650 — — 72,650
Other, net ................................ (279,394) 56,698 (21,067) 326,245 82,482
Changes in operating assets and
liabilities ............................... 462,768 (470,560) (288,307) — (296,099)
Net cash provided by (used in) operating
activities. ................................. 829,241 250,770 (16,962) — 1,063,049
Net cash (used in) provided by investing
activities. ................................. (144,149) (149,004) 14,137 80,133 (198,883)
Net cash used in financing activities . . . ...... (578,137) (109,898) (9,646) (80,133) (777,814)
Net change in cash and cash equivalents ..... 106,955 (8,132) (12,471) — 86,352
Cash and cash equivalents, beginning
of year . . ................................. 111,610 14,847 41,137 — 167,594
Cash and cash equivalents, end of year. ...... $ 218,565 $ 6,715 $ 28,666 $ — $ 253,946
F-40
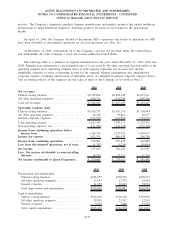
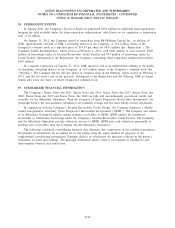
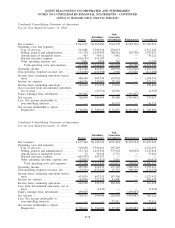
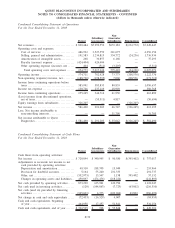
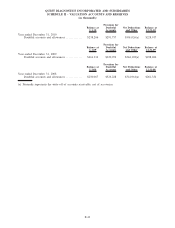
QUEST DIAGNOSTICS INCORPORATED AND SUBSIDIARIES
NOTES TO CONSOLIDATED FINANCIAL STATEMENTS - CONTINUED
(dollars in thousands unless otherwise indicated)