Quest Diagnostics 2010 Annual Report Download - page 57
Download and view the complete annual report
Please find page 57 of the 2010 Quest Diagnostics annual report below. You can navigate through the pages in the report by either clicking on the pages listed below, or by using the keyword search tool below to find specific information within the annual report.-
 1
1 -
2
-
3
-
4
-
5
-
6
-
7
-
8
-
9
-
10
-
11
-
12
-
13
-
14
-
15
-
16
-
17
-
18
-
19
-
20
-
21
-
22
-
23
-
24
-
25
-
26
-
27
-
28
-
29
-
30
-
31
-
32
-
33
-
34
-
35
-
36
-
37
-
38
-
39
-
40
-
41
-
42
-
43
-
44
-
45
-
46
-
 47
47 -
 48
48 -
 49
49 -
 50
50 -
 51
51 -
 52
52 -
 53
53 -
 54
54 -
 55
55 -
 56
56 -
 57
57 -
 58
58 -
 59
59 -
 60
60 -
 61
61 -
 62
62 -
 63
63 -
 64
64 -
 65
65 -
 66
66 -
 67
67 -
68
-
69
-
70
-
71
-
72
-
73
-
74
-
75
-
76
-
77
-
78
-
79
-
80
-
81
-
82
-
83
-
84
-
85
-
86
-
87
-
88
-
89
-
90
-
91
-
92
-
93
-
94
-
95
-
96
-
97
-
98
-
99
-
100
-
101
-
102
-
103
-
104
-
105
-
106
-
107
-
108
-
109
-
110
-
111
-
112
-
113
-
114
 |
 |

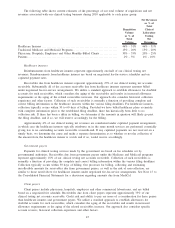
Year Ended December 31, 2009 Compared with Year Ended December 31, 2008
Continuing Operations
2009 2008
%
Change
Increase
(decrease)
(dollars in millions,
except per share data)
Net revenues ................................................................ $7,455.2 $7,249.4 2.8%
Income from continuing operations . . ......................................... 730.3 632.2 15.5%
Earnings per diluted share . .................................................. $ 3.88 $ 3.22 20.5%
The increase in income from continuing operations for the year ended December 31, 2009 from the prior
year was principally driven by improved operating performance and lower interest expense. Results for the year
ended December 31, 2009 include pre-tax charges of $20.4 million, or $0.07 per share, associated with the early
extinguishment of debt and $7.0 million, or $0.02 per share, associated with the write-down of an investment.
These charges were offset by a $15.5 million gain, or $0.05 per share, associated with an insurance settlement for
storm-related losses and a benefit of $0.04 per share resulting from certain discrete tax benefits.
Results for the year ended December 31, 2008 include a third quarter charge of $8.9 million, or $0.03 per
share, associated with the write-down of an equity investment and pre-tax charges of $16.2 million, or $0.05 per
share, primarily associated with workforce reductions. These charges were offset by favorable resolutions of
various tax contingencies in 2008, which increased earnings per share by $0.08. In addition, we estimate the
impact of hurricanes in the third quarter of 2008 adversely impacted operating income for the year ended
December 31, 2008 by approximately $8 million or $0.02 per share.
Net Revenues
Net revenues for the year ended December 31, 2009 grew by 2.8% over the prior year level to $7.5 billion.
Changes in foreign exchange rates reduced revenue growth for the year ended December 31, 2009 by 0.4%.
For 2009, revenues of our clinical testing business, which accounts for over 90% of our net revenues, grew
3.2% above the prior year level. Declines in pre-employment drug testing, which is part of our clinical testing
business, reduced consolidated revenues by 0.7%.
Clinical testing volume, measured by the number of requisitions, decreased 0.7% for the year ended
December 31, 2009. Pre-employment drug testing volume, which accounted for approximately 5% of our total
clinical testing volume in 2009, declined approximately 22% and reduced consolidated volume by 1.5%. We
believe the volume decrease in pre-employment drug testing continued to be principally due to reduced hiring by
employers served by this business. Our decision to exit certain laboratory management agreements that did not
meet our profitability thresholds also reduced volume by 0.4%.
Revenue per requisition increased 3.9% for the year ended December 31, 2009, with the increase primarily
driven by a positive test mix and a 4.5% increase in the Medicare laboratory fee schedule which went into effect
January 1, 2009 and contributed approximately a one-half percent increase in revenue per requisition.
Our businesses other than clinical testing accounted for approximately 8% of our net revenues in 2009.
These businesses include our risk assessment services, clinical trials testing, healthcare information technology
and diagnostic products businesses. These businesses contain most of our international operations and, in the
aggregate, reported revenues for 2009 were comparable to the prior year level, despite the impact of foreign
exchange which reduced the combined revenues of these businesses by approximately 4%.
54