Quest Diagnostics 2010 Annual Report Download - page 107
Download and view the complete annual report
Please find page 107 of the 2010 Quest Diagnostics annual report below. You can navigate through the pages in the report by either clicking on the pages listed below, or by using the keyword search tool below to find specific information within the annual report.-
 1
1 -
2
-
3
-
4
-
5
-
6
-
7
-
8
-
9
-
10
-
11
-
12
-
13
-
14
-
15
-
16
-
17
-
18
-
19
-
20
-
21
-
22
-
23
-
24
-
25
-
26
-
27
-
28
-
29
-
30
-
31
-
32
-
33
-
34
-
35
-
36
-
37
-
38
-
39
-
40
-
41
-
42
-
43
-
44
-
45
-
46
-
47
-
48
-
49
-
50
-
51
-
52
-
53
-
54
-
55
-
56
-
57
-
58
-
59
-
60
-
61
-
62
-
63
-
64
-
65
-
66
-
67
-
68
-
69
-
70
-
71
-
72
-
73
-
74
-
75
-
76
-
77
-
78
-
79
-
80
-
81
-
82
-
83
-
84
-
85
-
86
-
87
-
88
-
89
-
90
-
91
-
92
-
93
-
94
-
95
-
96
-
 97
97 -
 98
98 -
 99
99 -
 100
100 -
 101
101 -
 102
102 -
 103
103 -
 104
104 -
 105
105 -
 106
106 -
 107
107 -
 108
108 -
 109
109 -
 110
110 -
 111
111 -
 112
112 -
 113
113 -
 114
114
 |
 |

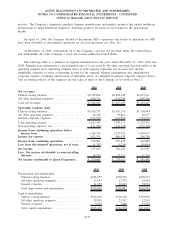
QUEST DIAGNOSTICS INCORPORATED AND SUBSIDIARIES
Quarterly Operating Results (unaudited)
(in thousands, except per share data)
First
Quarter
Second
Quarter
Third
Quarter
Fourth
Quarter
Total
Year
2010 (a)
Net revenues. . . ................................. $1,805,503(b) $1,874,727 $1,864,655 $1,824,040 $7,368,925
Gross profit..................................... 739,130(b) 795,756 773,190 743,602 3,051,678
Income from continuing operations. . ............. 171,205(b)(c) 204,142 208,116(d) 175,341(e) 758,804
Loss from discontinued operations, net of taxes . . . (52) (266) (360) (1,109) (1,787)
Net income ..................................... 171,153 203,876 207,756 174,232 757,017
Less: Net income attributable to noncontrolling
interests . ..................................... 8,705 9,261 9,681 8,476 36,123
Net income attributable to Quest Diagnostics ..... $ 162,448 $ 194,615 $ 198,075 $ 165,756 $ 720,894
Amounts attributable to Quest Diagnostics’
stockholders:
Income from continuing operations. . ............. $ 162,500 $ 194,881 $ 198,435 $ 166,865 $ 722,681
Loss from discontinued operations, net of taxes . . . (52) (266) (360) (1,109) (1,787)
Net income ..................................... $ 162,448 $ 194,615 $ 198,075 $ 165,756 $ 720,894
Earnings per share attributable to Quest
Diagnostics’ stockholders – basic:
Income from continuing operations. . ............. $ 0.90 $ 1.08 $ 1.14 $ 0.97 $ 4.09
Loss from discontinued operations . . ............. — — — (0.01) (0.01)
Net income ..................................... $ 0.90 $ 1.08 $ 1.14 $ 0.96 $ 4.08
Earnings per share attributable to Quest
Diagnostics’ stockholders – diluted:
Income from continuing operations. . ............. $ 0.89 $ 1.07 $ 1.13 $ 0.97 $ 4.06
Loss from discontinued operations . . ............. — — — (0.01) (0.01)
Net income ..................................... $ 0.89 $ 1.07 $ 1.13 $ 0.96 $ 4.05
First
Quarter
Second
Quarter
Third
Quarter
Fourth
Quarter
Total
Year
2009 (a)
Net revenues. . . ................................. $1,808,006 $1,901,818 $1,897,146 $1,848,273 $7,455,243
Gross profit..................................... 754,517 801,606 799,611 778,034 3,133,768
Income from continuing operations. . ............. 177,327 198,281(f)(g) 201,092(h) 190,758(i) 767,458
(Loss) income from discontinued operations, net
of taxes . ..................................... (1,671) 88 543 (196) (1,236)
Net income ..................................... 175,656 198,369 201,635 190,562 766,222
Less: Net income attributable to noncontrolling
interests . ..................................... 8,554 10,169 9,416 8,972 37,111
Net income attributable to Quest Diagnostics ..... $ 167,102 $ 188,200 $ 192,219 $ 181,590 $ 729,111
Amounts attributable to Quest Diagnostics’
stockholders:
Income from continuing operations. . ............. $ 168,773 $ 188,112 $ 191,676 $ 181,786 $ 730,347
(Loss) income from discontinued operations, net
of taxes . ..................................... (1,671) 88 543 (196) (1,236)
Net income ..................................... $ 167,102 $ 188,200 $ 192,219 $ 181,590 $ 729,111
Earnings per share attributable to Quest
Diagnostics’ stockholders – basic:
Income from continuing operations. . ............. $ 0.89 $ 1.01 $ 1.03 $ 0.98 $ 3.92
Loss from discontinued operations . . ............. (0.01) — — — (0.01)
Net income ..................................... $ 0.88 $ 1.01 $ 1.03 $ 0.98 $ 3.91
Earnings per share attributable to Quest
Diagnostics’ stockholders – diluted:
Income from continuing operations. . ............. $ 0.89 $ 1.00 $ 1.02 $ 0.97 $ 3.88
Loss from discontinued operations . . ............. (0.01) — — — (0.01)
Net income ..................................... $ 0.88 $ 1.00 $ 1.02 $ 0.97 $ 3.87
F-41