Quest Diagnostics 2010 Annual Report Download - page 44
Download and view the complete annual report
Please find page 44 of the 2010 Quest Diagnostics annual report below. You can navigate through the pages in the report by either clicking on the pages listed below, or by using the keyword search tool below to find specific information within the annual report.-
 1
1 -
2
-
3
-
4
-
5
-
6
-
7
-
8
-
9
-
10
-
11
-
12
-
13
-
14
-
15
-
16
-
17
-
18
-
19
-
20
-
21
-
22
-
23
-
24
-
25
-
26
-
27
-
28
-
29
-
30
-
31
-
32
-
33
-
 34
34 -
 35
35 -
 36
36 -
 37
37 -
 38
38 -
 39
39 -
 40
40 -
 41
41 -
 42
42 -
 43
43 -
 44
44 -
 45
45 -
 46
46 -
 47
47 -
 48
48 -
 49
49 -
 50
50 -
 51
51 -
 52
52 -
 53
53 -
 54
54 -
55
-
56
-
57
-
58
-
59
-
60
-
61
-
62
-
63
-
64
-
65
-
66
-
67
-
68
-
69
-
70
-
71
-
72
-
73
-
74
-
75
-
76
-
77
-
78
-
79
-
80
-
81
-
82
-
83
-
84
-
85
-
86
-
87
-
88
-
89
-
90
-
91
-
92
-
93
-
94
-
95
-
96
-
97
-
98
-
99
-
100
-
101
-
102
-
103
-
104
-
105
-
106
-
107
-
108
-
109
-
110
-
111
-
112
-
113
-
114
 |
 |

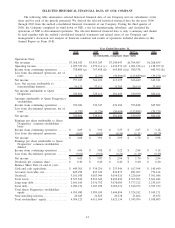
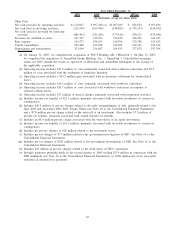
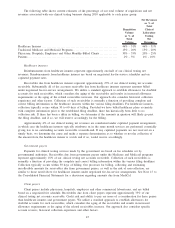
SELECTED HISTORICAL FINANCIAL DATA OF OUR COMPANY
The following table summarizes selected historical financial data of our Company and our subsidiaries at the
dates and for each of the periods presented. We derived the selected historical financial data for the years 2006
through 2010 from the audited consolidated financial statements of our Company. During the third quarter of
2006, the Company completed its wind down of NID, a test kit manufacturing subsidiary, and classified the
operations of NID as discontinued operations. The selected historical financial data is only a summary and should
be read together with the audited consolidated financial statements and related notes of our Company and
management’s discussion and analysis of financial condition and results of operations included elsewhere in this
Annual Report on Form 10-K.
2010 2009 2008 2007(a) 2006
Year Ended December 31,
(in thousands, except per share data)
Operations Data:
Net revenues ............................. $7,368,925 $7,455,243 $7,249,447 $6,704,907 $6,268,659
Operating income. . ....................... 1,295,535 (b) 1,359,111 (c) 1,222,376 (d) 1,091,336 (e) 1,128,077 (f)
Income from continuing operations ........ 758,804 (g) 767,458 (h) 663,889 (i)(j) 580,338 649,592 (k)
Loss from discontinued operations, net of
taxes . . ................................ (1,787) (1,236) (50,694)(l) (213,889)(m) (39,271) (n)
Net income .............................. 757,017 766,222 613,195 366,449 610,321
Less: Net income attributable to
noncontrolling interests . . . .............. 36,123 37,111 31,705 26,510 23,900
Net income attributable to Quest
Diagnostics ............................ 720,894 729,111 581,490 339,939 586,421
Amounts attributable to Quest Diagnostics’
stockholders:
Income from continuing operations ........ 722,681 730,347 632,184 553,828 625,692
Loss from discontinued operations, net of
taxes . . ................................ (1,787) (1,236) (50,694) (213,889) (39,271)
Net income .............................. 720,894 729,111 581,490 339,939 586,421
Earnings per share attributable to Quest
Diagnostics’ common stockholders –
basic:
Income from continuing operations ........ $ 4.09 $ 3.92 $ 3.25 $ 2.87 $ 3.18
Loss from discontinued operations ......... (0.01) (0.01) (0.26) (1.11) (0.20)
Net income .............................. $ 4.08 $ 3.91 $ 2.99 $ 1.76 $ 2.98
Earnings per share attributable to Quest
Diagnostics’ common stockholders –
diluted:
Income from continuing operations ........ $ 4.06 $ 3.88 $ 3.22 $ 2.84 $ 3.14
Loss from discontinued operations ......... (0.01) (0.01) (0.26) (1.10) (0.20)
Net income .............................. $ 4.05 $ 3.87 $ 2.96 $ 1.74 $ 2.94
Dividends per common share.............. $ 0.40 $ 0.40 $ 0.40 $ 0.40 $ 0.40
Balance Sheet Data (at end of year):
Cash and cash equivalents . . .............. $ 449,301 $ 534,256 $ 253,946 $ 167,594 $ 149,640
Accounts receivable, net .................. 845,299 827,343 832,873 881,967 774,414
Goodwill . ................................ 5,101,938 5,083,944 5,054,926 5,220,104 3,391,046
Total assets .............................. 8,527,630 8,563,643 8,403,830 8,565,693 5,661,482
Long-term debt ........................... 2,641,160 2,936,792 3,078,089 3,377,212 1,239,105
Total debt................................ 2,990,156 3,107,299 3,083,231 3,540,793 1,555,979
Total Quest Diagnostics stockholders’
equity . ................................ 4,033,480 3,989,639 3,604,896 3,324,242 3,019,171
Noncontrolling interests ................... 20,645 21,825 20,238 21,464 19,632
Total stockholders’ equity . . . .............. 4,054,125 4,011,464 3,625,134 3,345,706 3,038,803
41