Quest Diagnostics 2010 Annual Report Download - page 55
Download and view the complete annual report
Please find page 55 of the 2010 Quest Diagnostics annual report below. You can navigate through the pages in the report by either clicking on the pages listed below, or by using the keyword search tool below to find specific information within the annual report.-
 1
1 -
2
-
3
-
4
-
5
-
6
-
7
-
8
-
9
-
10
-
11
-
12
-
13
-
14
-
15
-
16
-
17
-
18
-
19
-
20
-
21
-
22
-
23
-
24
-
25
-
26
-
27
-
28
-
29
-
30
-
31
-
32
-
33
-
34
-
35
-
36
-
37
-
38
-
39
-
40
-
41
-
42
-
43
-
44
-
 45
45 -
 46
46 -
 47
47 -
 48
48 -
 49
49 -
 50
50 -
 51
51 -
 52
52 -
 53
53 -
 54
54 -
 55
55 -
 56
56 -
 57
57 -
 58
58 -
 59
59 -
 60
60 -
 61
61 -
 62
62 -
 63
63 -
 64
64 -
 65
65 -
66
-
67
-
68
-
69
-
70
-
71
-
72
-
73
-
74
-
75
-
76
-
77
-
78
-
79
-
80
-
81
-
82
-
83
-
84
-
85
-
86
-
87
-
88
-
89
-
90
-
91
-
92
-
93
-
94
-
95
-
96
-
97
-
98
-
99
-
100
-
101
-
102
-
103
-
104
-
105
-
106
-
107
-
108
-
109
-
110
-
111
-
112
-
113
-
114
 |
 |

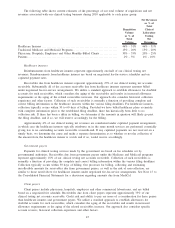
Such adjustments to the deferred compensation obligation are recorded in earnings, principally within selling,
general and administrative expenses, and offset the amount of investment gains and losses recorded in other
income (expense), net. Results for the years ended December 31, 2010 and 2009 included increases in operating
costs of $5.7 and $8.4 million, respectively, representing increases in the deferred compensation obligation to
reflect investment gains earned by employees participating in our deferred compensation plans.
Cost of Services
Cost of services includes the costs of obtaining, transporting and testing specimens. For the year ended
December 31, 2010, cost of services increased, as a percentage of revenue, primarily as a result of lower
revenues in our clinical testing business, including the impact of severe weather in the first quarter of 2010, and
charges associated with workforce reductions in response to lower testing volume, partially offset by actions
taken to reduce our cost structure, reduced performance-based compensation and improved experience associated
with professional liability claims.
Selling, General and Administrative Expenses
Selling, general and administrative expenses include the costs of the sales force, billing operations, bad debt
expense, and general management and administrative support. For the year ended December 31, 2010, selling,
general and administrative expenses decreased as a percentage of revenue from prior year primarily as a result of
reduced bad debt expense. In addition, activities in 2010 to adjust our cost structure in response to lower testing
volume and reduced performance-based compensation, partially offset by charges principally associated with
workforce reductions, reduced selling, general and administrative expenses as a percentage of revenues. Continued
progress in our billing and collection processes has resulted in improvements in bad debt and the cost of our
billing operation.
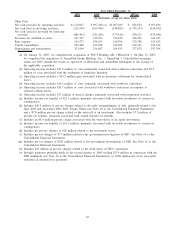
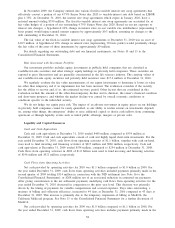
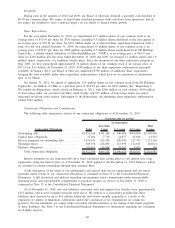
Other Operating Expense (Income), net
Other operating expense (income), net represents miscellaneous income and expense items related to
operating activities and for the years ended December 31, 2010 and 2009, consisted of the following:
2010 2009 Change
(dollars in millions)
Insurance settlement for storm-related losses.......................................... $ — $(15.5) $15.5
Settlement of employee litigation .................................................... 9.6 — 9.6
Foreign currency transaction losses, net .............................................. 1.9 2.1 (0.2)
Other operating (income) expense items, net.......................................... (2.2) 3.4 (5.6)
Total other operating expense (income), net...................................... $ 9.3 $(10.0) $19.3
Operating Income
$
% Net
Revenues $
% Net
Revenues $
% Net
Revenues
2010 2009
Change
Increase (decrease)
(dollars in millions)
Operating income ............................. $1,295.5 17.6% $1,359.1 18.2% $(63.6) (0.6)%
Operating income for the year ended December 31, 2010 decreased as a percentage of net revenues from the
prior year, primarily as a result of the impact of lower revenues in our clinical testing business, including the
estimated impact of severe weather in the first quarter of 2010, charges associated with workforce reductions and
employee litigation, partially offset by actions taken to adjust our cost structure, reduced cost of performance-
based compensation, improved experience associated with professional liability claims and lower bad debt
expense. The estimated impact of severe weather in the first quarter of 2010, combined with charges associated
with actions we have taken to adjust our cost structure, and the settlement of employee litigation adversely
impacted the year-over-year change in operating income as a percentage of net revenues by 0.7% compared to
the prior year. In addition, the year-over-year change in operating income as a percentage of net revenues was
also adversely impacted by 0.2% associated with a $15.5 million gain recorded in 2009 related to an insurance
settlement for storm-related losses.
52