Quest Diagnostics 2010 Annual Report Download - page 82
Download and view the complete annual report
Please find page 82 of the 2010 Quest Diagnostics annual report below. You can navigate through the pages in the report by either clicking on the pages listed below, or by using the keyword search tool below to find specific information within the annual report.-
 1
1 -
2
-
3
-
4
-
5
-
6
-
7
-
8
-
9
-
10
-
11
-
12
-
13
-
14
-
15
-
16
-
17
-
18
-
19
-
20
-
21
-
22
-
23
-
24
-
25
-
26
-
27
-
28
-
29
-
30
-
31
-
32
-
33
-
34
-
35
-
36
-
37
-
38
-
39
-
40
-
41
-
42
-
43
-
44
-
45
-
46
-
47
-
48
-
49
-
50
-
51
-
52
-
53
-
54
-
55
-
56
-
57
-
58
-
59
-
60
-
61
-
62
-
63
-
64
-
65
-
66
-
67
-
68
-
69
-
70
-
71
-
 72
72 -
 73
73 -
 74
74 -
 75
75 -
 76
76 -
 77
77 -
 78
78 -
 79
79 -
 80
80 -
 81
81 -
 82
82 -
 83
83 -
 84
84 -
 85
85 -
 86
86 -
 87
87 -
 88
88 -
 89
89 -
 90
90 -
 91
91 -
 92
92 -
93
-
94
-
95
-
96
-
97
-
98
-
99
-
100
-
101
-
102
-
103
-
104
-
105
-
106
-
107
-
108
-
109
-
110
-
111
-
112
-
113
-
114
 |
 |

classified within Level 2 because their inputs are derived principally from observable market data by correlation
to the hypothetical investments.
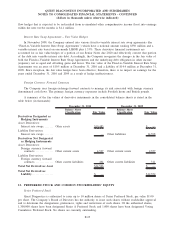
The fair value measurements of foreign currency forward contracts are obtained from a third-party pricing
service and are based on market prices in actual transactions and other relevant information generated by market
transactions involving identical or comparable assets or liabilities. The fair value measurements of the Company’s
interest rate swaps are model-derived valuations as of a given date in which all significant inputs are observable
in active markets including certain financial information and certain assumptions regarding past, present and
future market conditions. The Company does not believe that the changes in the fair values of its foreign
currency forward contracts and interest rate swaps will materially differ from the amounts that could be realized
upon settlement or maturity or that the changes in fair value will have a material effect on its results of
operations, liquidity and capital resources.
Investments in available-for-sale equity securities consist of the revaluation of an existing investment in
unregistered common shares of a publicly-held company. This investment is classified within Level 3 because the
unregistered securities contain restrictions on their sale, and therefore, the fair value measurement reflects a
discount for the effect of the restriction.
In the second quarter of 2009, the Company recorded a charge of $7.0 million associated with the write-
down of an investment due to the uncertainty of recoverability from an other-than-temporary impairment loss. A
fair value measurement, using significant unobservable inputs, has been applied to this asset on a non-recurring
basis.
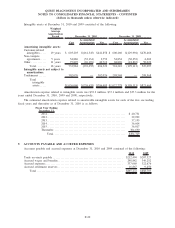
The carrying amounts of cash and cash equivalents, accounts receivable and accounts payable and accrued
expenses approximate fair value based on the short maturities of these instruments. At December 31, 2010 and
2009, the fair value of the Company’s debt was estimated at approximately $3.1 billion and $3.3 billion,
respectively, using quoted market prices and yields for the same or similar types of borrowings, taking into
account the underlying terms of the debt instruments. At December 31, 2010 and 2009, the estimated fair value
exceeded the carrying value of the debt by $80 million and $151 million, respectively.
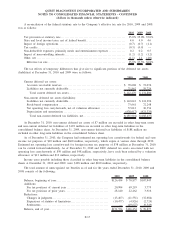
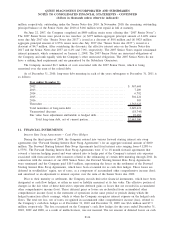
5. TAXES ON INCOME
The Company’s pre-tax income (loss) from continuing operations consisted of $1.18 billion, $1.23 billion
and $1.05 billion from U.S. operations and $1.9 million, $1.8 million and $(1.2) million from foreign operations
for the years ended December 31, 2010, 2009 and 2008, respectively.
The components of income tax expense (benefit) for 2010, 2009 and 2008 were as follows:
2010 2009 2008
Current:
Federal . ........................................................ $346,739 $350,582 $299,937
State and local . . . ............................................... 93,369 81,292 57,750
Foreign . ........................................................ 4,132 3,193 3,833
Deferred:
Federal . ........................................................ (5,103) 30,624 20,764
State and local . . . ............................................... (11,197) (3,552) 10,029
Foreign . ........................................................ (2,409) (1,665) (5,545)
Total . ........................................................ $425,531 $460,474 $386,768
F-16
QUEST DIAGNOSTICS INCORPORATED AND SUBSIDIARIES
NOTES TO CONSOLIDATED FINANCIAL STATEMENTS - CONTINUED
(dollars in thousands unless otherwise indicated)