Quest Diagnostics 2010 Annual Report Download - page 38
Download and view the complete annual report
Please find page 38 of the 2010 Quest Diagnostics annual report below. You can navigate through the pages in the report by either clicking on the pages listed below, or by using the keyword search tool below to find specific information within the annual report.-
 1
1 -
2
-
3
-
4
-
5
-
6
-
7
-
8
-
9
-
10
-
11
-
12
-
13
-
14
-
15
-
16
-
17
-
18
-
19
-
20
-
21
-
22
-
23
-
24
-
25
-
26
-
27
-
 28
28 -
 29
29 -
 30
30 -
 31
31 -
 32
32 -
 33
33 -
 34
34 -
 35
35 -
 36
36 -
 37
37 -
 38
38 -
 39
39 -
 40
40 -
 41
41 -
 42
42 -
 43
43 -
 44
44 -
 45
45 -
 46
46 -
 47
47 -
 48
48 -
49
-
50
-
51
-
52
-
53
-
54
-
55
-
56
-
57
-
58
-
59
-
60
-
61
-
62
-
63
-
64
-
65
-
66
-
67
-
68
-
69
-
70
-
71
-
72
-
73
-
74
-
75
-
76
-
77
-
78
-
79
-
80
-
81
-
82
-
83
-
84
-
85
-
86
-
87
-
88
-
89
-
90
-
91
-
92
-
93
-
94
-
95
-
96
-
97
-
98
-
99
-
100
-
101
-
102
-
103
-
104
-
105
-
106
-
107
-
108
-
109
-
110
-
111
-
112
-
113
-
114
 |
 |
grants under the Stock Compensation Plans) to offset tax withholding obligations that occur upon the
delivery of outstanding common shares underlying restricted stock units and performance share units.
(C) In January 2011, our Board of Directors authorized the Company to repurchase an additional $750 million of
the Company’s common stock, bringing the total amount that the Company was authorized to repurchase to
$1.0 billion. The share repurchase authorization has no set expiration or termination date.
On January 31, 2011, the Company agreed to repurchase 15.4 million shares of its common stock from SB
Holdings Capital Inc., an affiliate of GlaxoSmithKline plc, at a purchase price of $54.30 per share for $835
million (the “Repurchase”). Subsequent to the Repurchase, which closed on February 4, 2011, the Company’s
remaining share repurchase authorization totaled $165 million.
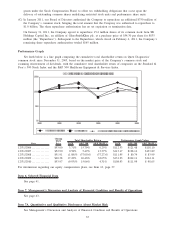
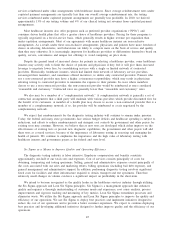
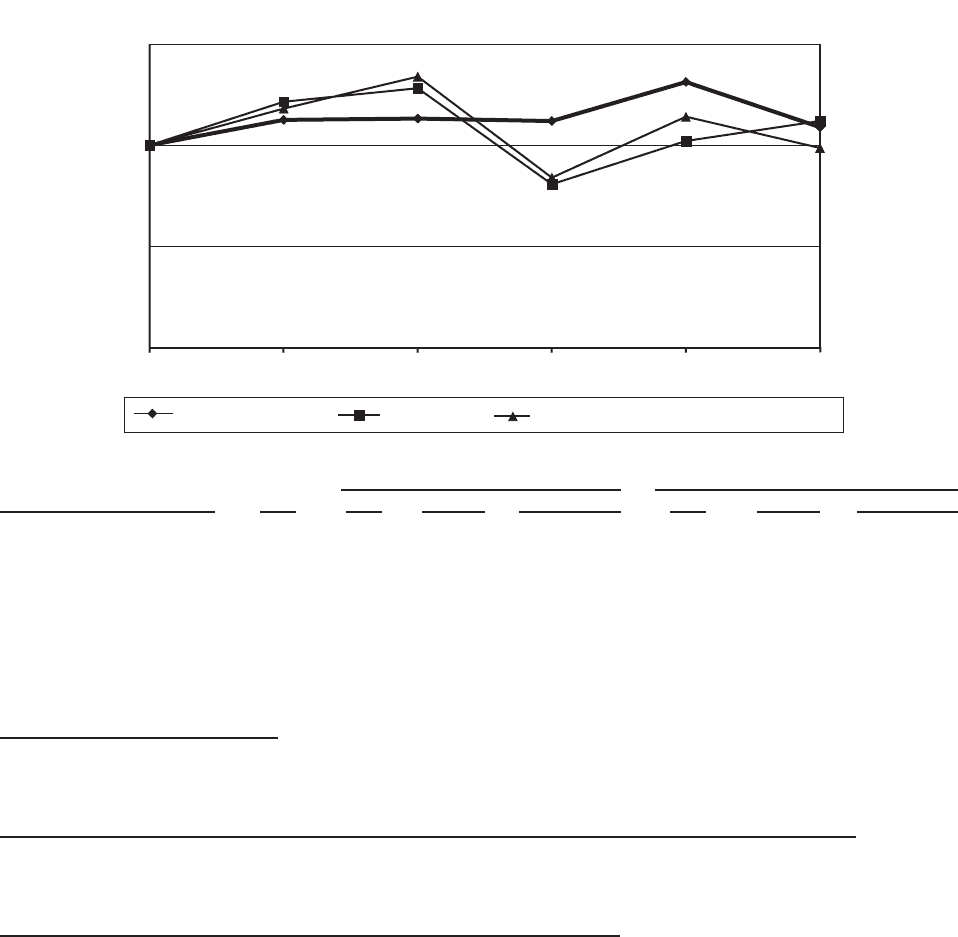
Performance Graph
Set forth below is a line graph comparing the cumulative total shareholder return on Quest Diagnostics’
common stock since December 31, 2005, based on the market price of the Company’s common stock and
assuming reinvestment of dividends, with the cumulative total shareholder return of companies on the Standard &
Poor’s 500 Stock Index and the S&P 500 Healthcare Equipment & Services Index.
Comparison of Cumulative Five Year Total Return
$0
$50
$100
$150
201020092008200720062005
S&P 500 Health Care Equipment & Services Index
S&P 500 Index
Quest Diagnostics, Inc.
Date
Closing
DGX
Price DGX S&P 500 S&P 500 H.C. DGX S&P 500 S&P 500 H.C.
Total Shareholder Return Performance Graph Values
12/31/2006 . . ............ $53.00 3.71% 15.79% 0.25% $112.53 $121.48 $118.10
12/31/2007 . . ............ $52.90 0.58% 5.49% 13.37% $113.17 $128.16 $133.89
12/31/2008 . . ............ $51.91 (1.08)% (37.00)% (37.27)% $111.95 $ 80.74 $ 83.99
12/31/2009 . . ............ $60.38 17.22% 26.46% 32.65% $131.23 $102.11 $114.11
12/31/2010 . . ............ $53.97 (9.93)% 15.06% 4.31% $108.93 $111.99 $ 98.65
For information regarding our equity compensation plans, see Item 12, page 37.
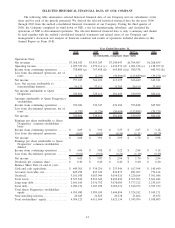
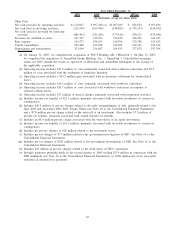
Item 6. Selected Financial Data
See page 41.
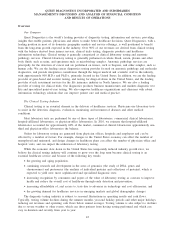
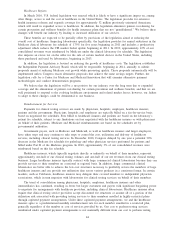
Item 7. Management’s Discussion and Analysis of Financial Condition and Results of Operations
See page 43.
Item 7A. Quantitative and Qualitative Disclosures About Market Risk
See Management’s Discussion and Analysis of Financial Condition and Results of Operations.
35