Quest Diagnostics 2010 Annual Report Download - page 53
Download and view the complete annual report
Please find page 53 of the 2010 Quest Diagnostics annual report below. You can navigate through the pages in the report by either clicking on the pages listed below, or by using the keyword search tool below to find specific information within the annual report.-
 1
1 -
2
-
3
-
4
-
5
-
6
-
7
-
8
-
9
-
10
-
11
-
12
-
13
-
14
-
15
-
16
-
17
-
18
-
19
-
20
-
21
-
22
-
23
-
24
-
25
-
26
-
27
-
28
-
29
-
30
-
31
-
32
-
33
-
34
-
35
-
36
-
37
-
38
-
39
-
40
-
41
-
42
-
 43
43 -
 44
44 -
 45
45 -
 46
46 -
 47
47 -
 48
48 -
 49
49 -
 50
50 -
 51
51 -
 52
52 -
 53
53 -
 54
54 -
 55
55 -
 56
56 -
 57
57 -
 58
58 -
 59
59 -
 60
60 -
 61
61 -
 62
62 -
 63
63 -
64
-
65
-
66
-
67
-
68
-
69
-
70
-
71
-
72
-
73
-
74
-
75
-
76
-
77
-
78
-
79
-
80
-
81
-
82
-
83
-
84
-
85
-
86
-
87
-
88
-
89
-
90
-
91
-
92
-
93
-
94
-
95
-
96
-
97
-
98
-
99
-
100
-
101
-
102
-
103
-
104
-
105
-
106
-
107
-
108
-
109
-
110
-
111
-
112
-
113
-
114
 |
 |

Plan. Stock-based compensation expense associated with performance share units is recognized based on
management’s best estimates of the achievement of the performance goals specified in such awards and the
resulting number of shares that will be earned. If the actual number of performance share units earned is different
from our estimates, stock-based compensation could be significantly different from what we have recorded in the
current period. The cumulative effect on current and prior periods of a change in the estimated number of
performance share units expected to be earned is recognized as compensation cost in earnings in the period of
the revision. While the assumptions used to calculate and account for stock-based compensation awards represent
management’s best estimates, these estimates involve inherent uncertainties and the application of management’s
judgment. As a result, if revisions are made to our assumptions and estimates, our stock-based compensation
expense could vary significantly from period to period. In addition, the number of awards made under our equity
compensation plans, changes in the design of those plans, the price of our shares and the performance of our
Company can all cause stock-based compensation expense to vary from period to period.
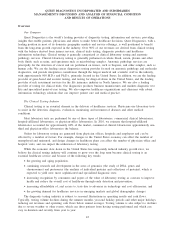
Results of Operations
Our clinical testing business currently represents our one reportable business segment. The clinical testing
business for each of the three years in the period ended December 31, 2010 accounted for more than 90% of net
revenues from continuing operations. Our other operating segments consist of our risk assessment services,
clinical trials testing, healthcare information technology and diagnostic products businesses. On April 19, 2006,
we decided to discontinue the operations of a test kit manufacturing subsidiary, NID. During the third quarter of
2006, we completed the wind down of NID. Therefore, the operations of NID are classified as discontinued
operations for all periods presented. Our business segment information is disclosed in Note 17 to the
Consolidated Financial Statements.
Year Ended December 31, 2010 Compared with Year Ended December 31, 2009
Continuing Operations
2010 2009
%
Change
Increase
(decrease)
(dollars in millions,
except per share data)
Net revenues ................................................................ $7,368.9 $7,455.2 (1.2)%
Income from continuing operations . . ......................................... 722.7 730.3 (1.0)%
Earnings per diluted share . .................................................. $ 4.06 $ 3.88 4.6%
Results for the year ended December 31, 2010 reflect lower revenues, compared to the prior year, which has
served to reduce income from continuing operations below the prior year level. Actions we have taken to adjust
our cost structure, reduced costs for performance-based compensation, improved experience associated with
professional liability claims and continued progress in reducing bad debt expense have served to partially mitigate
the impact to earnings from lower revenues. Lower outstanding share counts, resulting from share repurchases,
contributed $0.23 to the earnings per share improvement.
Results for the year ended December 31, 2010 include $27.0 million of pre-tax charges, or $0.09 per share,
principally associated with workforce reductions in the first and fourth quarters. Of these costs, $6.4 million and
$20.6 million, respectively, were included in cost of services and selling, general and administrative expenses.
Results for the year ended December 31, 2010 also include a $9.6 million fourth quarter pre-tax charge, or $0.03
per share, associated with the settlement of employee litigation and a benefit of $0.12 per share, primarily
associated with the favorable resolution of certain tax contingencies. In addition, we estimate that the impact of
severe weather in the first quarter of 2010 adversely affected the full year comparison of operating income to the
prior year by $14.3 million, or $0.05 per share.
Results for the year ended December 31, 2009 include pre-tax charges of $20.4 million, or $0.07 per share,
associated with the early extinguishment of debt and $7.0 million, or $0.02 per share, associated with the write-
down of an investment. These charges were offset by a $15.5 million gain, or $0.05 per share, associated with an
insurance settlement for storm-related losses and a benefit of $0.04 per share resulting from certain discrete tax
benefits.
50