Quest Diagnostics 2010 Annual Report Download - page 80
Download and view the complete annual report
Please find page 80 of the 2010 Quest Diagnostics annual report below. You can navigate through the pages in the report by either clicking on the pages listed below, or by using the keyword search tool below to find specific information within the annual report.-
 1
1 -
2
-
3
-
4
-
5
-
6
-
7
-
8
-
9
-
10
-
11
-
12
-
13
-
14
-
15
-
16
-
17
-
18
-
19
-
20
-
21
-
22
-
23
-
24
-
25
-
26
-
27
-
28
-
29
-
30
-
31
-
32
-
33
-
34
-
35
-
36
-
37
-
38
-
39
-
40
-
41
-
42
-
43
-
44
-
45
-
46
-
47
-
48
-
49
-
50
-
51
-
52
-
53
-
54
-
55
-
56
-
57
-
58
-
59
-
60
-
61
-
62
-
63
-
64
-
65
-
66
-
67
-
68
-
69
-
 70
70 -
 71
71 -
 72
72 -
 73
73 -
 74
74 -
 75
75 -
 76
76 -
 77
77 -
 78
78 -
 79
79 -
 80
80 -
 81
81 -
 82
82 -
 83
83 -
 84
84 -
 85
85 -
 86
86 -
 87
87 -
 88
88 -
 89
89 -
 90
90 -
91
-
92
-
93
-
94
-
95
-
96
-
97
-
98
-
99
-
100
-
101
-
102
-
103
-
104
-
105
-
106
-
107
-
108
-
109
-
110
-
111
-
112
-
113
-
114
 |
 |

In December 2010, the FASB issued an amendment related to the accounting for business combinations to
address diversity in practice about the interpretation of the pro forma revenue and earnings disclosure
requirements for business combinations. This standard will become effective for the Company on January 1, 2011
and is not expected to have a material impact on the Company’s consolidated financial statements.
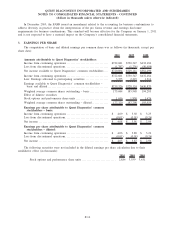
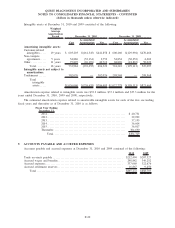
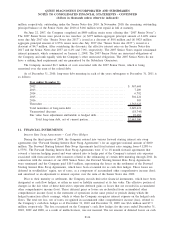
3. EARNINGS PER SHARE
The computation of basic and diluted earnings per common share was as follows (in thousands, except per
share data):
2010 2009 2008
Amounts attributable to Quest Diagnostics’ stockholders:
Income from continuing operations ................................. $722,681 $730,347 $632,184
Loss from discontinued operations .................................. (1,787) (1,236) (50,694)
Net income available to Quest Diagnostics’ common stockholders. . . . $720,894 $729,111 $581,490
Income from continuing operations ................................. $722,681 $730,347 $632,184
Less: Earnings allocated to participating securities................... 3,355 2,223 1,314
Earnings available to Quest Diagnostics’ common stockholders –
basic and diluted . ............................................... $719,326 $728,124 $630,870
Weighted average common shares outstanding – basic ............... 175,684 185,948 194,283
Effect of dilutive securities:
Stock options and performance share units .......................... 1,636 1,850 1,676
Weighted average common shares outstanding – diluted . . . .......... 177,320 187,798 195,959
Earnings per share attributable to Quest Diagnostics’ common
stockholders – basic:
Income from continuing operations ................................. $ 4.09 $ 3.92 $ 3.25
Loss from discontinued operations .................................. (0.01) (0.01) (0.26)
Net income ....................................................... $ 4.08 $ 3.91 $ 2.99
Earnings per share attributable to Quest Diagnostics’ common
stockholders – diluted:
Income from continuing operations ................................. $ 4.06 $ 3.88 $ 3.22
Loss from discontinued operations .................................. (0.01) (0.01) (0.26)
Net income ....................................................... $ 4.05 $ 3.87 $ 2.96
The following securities were not included in the diluted earnings per share calculation due to their
antidilutive effect (in thousands):
2010 2009 2008
Stock options and performance share units ........................... 2,886 3,559 3,631
F-14
QUEST DIAGNOSTICS INCORPORATED AND SUBSIDIARIES
NOTES TO CONSOLIDATED FINANCIAL STATEMENTS - CONTINUED
(dollars in thousands unless otherwise indicated)