Quest Diagnostics 2010 Annual Report Download - page 70
Download and view the complete annual report
Please find page 70 of the 2010 Quest Diagnostics annual report below. You can navigate through the pages in the report by either clicking on the pages listed below, or by using the keyword search tool below to find specific information within the annual report.-
 1
1 -
2
-
3
-
4
-
5
-
6
-
7
-
8
-
9
-
10
-
11
-
12
-
13
-
14
-
15
-
16
-
17
-
18
-
19
-
20
-
21
-
22
-
23
-
24
-
25
-
26
-
27
-
28
-
29
-
30
-
31
-
32
-
33
-
34
-
35
-
36
-
37
-
38
-
39
-
40
-
41
-
42
-
43
-
44
-
45
-
46
-
47
-
48
-
49
-
50
-
51
-
52
-
53
-
54
-
55
-
56
-
57
-
58
-
59
-
 60
60 -
 61
61 -
 62
62 -
 63
63 -
 64
64 -
 65
65 -
 66
66 -
 67
67 -
 68
68 -
 69
69 -
 70
70 -
 71
71 -
 72
72 -
 73
73 -
 74
74 -
 75
75 -
 76
76 -
 77
77 -
 78
78 -
 79
79 -
 80
80 -
81
-
82
-
83
-
84
-
85
-
86
-
87
-
88
-
89
-
90
-
91
-
92
-
93
-
94
-
95
-
96
-
97
-
98
-
99
-
100
-
101
-
102
-
103
-
104
-
105
-
106
-
107
-
108
-
109
-
110
-
111
-
112
-
113
-
114
 |
 |

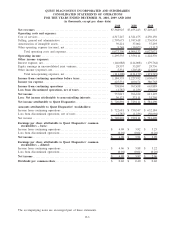
QUEST DIAGNOSTICS INCORPORATED AND SUBSIDIARIES
CONSOLIDATED STATEMENTS OF CASH FLOWS
FOR THE YEARS ENDED DECEMBER 31, 2010, 2009 AND 2008
(in thousands)
2010 2009 2008
Cash flows from operating activities:
Net income........................................................... $ 757,017 $ 766,222 $ 613,195
Adjustments to reconcile net income to net cash provided by operating
activities:
Depreciation and amortization ......................................... 253,964 256,687 264,593
Provision for doubtful accounts ........................................ 291,737 320,974 326,228
Provision for special charges .......................................... — — 72,650
Deferred income tax (benefit) provision ................................ (18,878) 83,120 549
Stock-based compensation expense..................................... 53,927 75,059 70,581
Excess tax benefits from stock-based compensation arrangements. . ...... (884) (5,540) (2,420)
Other, net ............................................................ 22,967 29,699 13,772
Changes in operating assets and liabilities:
Accounts receivable .............................................. (309,932) (314,102) (282,634)
Accounts payable and accrued expenses . . . ........................ 18,235 56,533 (12,565)
Settlement and other special charges .............................. — (314,386) —
Income taxes payable. . . .......................................... 33,732 21,190 24,653
Other assets and liabilities, net . . . ................................. 16,162 21,962 (25,553)
Net cash provided by operating activities ............................ 1,118,047 997,418 1,063,049
Cash flows from investing activities:
Business acquisitions, net of cash acquired ............................. — (18,295) 8,066
Capital expenditures .................................................. (205,400) (166,928) (212,681)
(Increase) decrease in investments and other assets ..................... (11,110) (10,681) 5,732
Net cash used in investing activities .................................. (216,510) (195,904) (198,883)
Cash flows from financing activities:
Proceeds from borrowings . . . .......................................... — 1,245,525 22,929
Repayments of debt................................................... (169,491) (1,218,538) (481,870)
Purchases of treasury stock. . .......................................... (750,000) (499,991) (253,997)
Exercise of stock options.............................................. 48,535 87,120 30,511
Excess tax benefits from stock-based compensation arrangements. . ...... 884 5,540 2,420
Dividends paid ....................................................... (71,321) (74,748) (77,964)
Distributions to noncontrolling interests ................................ (36,739) (35,524) (32,931)
Other financing activities.............................................. (8,360) (30,588) 13,088
Net cash used in financing activities ................................. (986,492) (521,204) (777,814)
Net change in cash and cash equivalents ............................. (84,955) 280,310 86,352
Cash and cash equivalents, beginning of year ........................ 534,256 253,946 167,594
Cash and cash equivalents, end of year .............................. $ 449,301 $ 534,256 $ 253,946
The accompanying notes are an integral part of these statements.
F-4