Quest Diagnostics 2008 Annual Report Download - page 91
Download and view the complete annual report
Please find page 91 of the 2008 Quest Diagnostics annual report below. You can navigate through the pages in the report by either clicking on the pages listed below, or by using the keyword search tool below to find specific information within the annual report.-
 1
1 -
2
-
3
-
4
-
5
-
6
-
7
-
8
-
9
-
10
-
11
-
12
-
13
-
14
-
15
-
16
-
17
-
18
-
19
-
20
-
21
-
22
-
23
-
24
-
25
-
26
-
27
-
28
-
29
-
30
-
31
-
32
-
33
-
34
-
35
-
36
-
37
-
38
-
39
-
40
-
41
-
42
-
43
-
44
-
45
-
46
-
47
-
48
-
49
-
50
-
51
-
52
-
53
-
54
-
55
-
56
-
57
-
58
-
59
-
60
-
61
-
62
-
63
-
64
-
65
-
66
-
67
-
68
-
69
-
70
-
71
-
72
-
73
-
74
-
75
-
76
-
77
-
78
-
79
-
80
-
 81
81 -
 82
82 -
 83
83 -
 84
84 -
 85
85 -
 86
86 -
 87
87 -
 88
88 -
 89
89 -
 90
90 -
 91
91 -
 92
92 -
 93
93 -
 94
94 -
 95
95 -
 96
96 -
 97
97 -
 98
98 -
 99
99 -
 100
100 -
 101
101 -
102
-
103
-
104
-
105
-
106
-
107
-
108
-
109
-
110
-
111
-
112
-
113
-
114
-
115
-
116
-
117
-
118
-
119
-
120
-
121
-
122
-
123
-
124
-
125
-
126
-
127
-
128
 |
 |

2007 2006
Net revenues .............................................................. $7,038,781 $7,020,980
Net income ............................................................... 263,225 593,677
Basic earnings per common share:
Net income ............................................................... $ 1.36 $ 3.01
Weighted average common shares outstanding – basic. ...................... 193,241 196,985
Diluted earnings per common share:
Net income ............................................................... $ 1.35 $ 2.98
Weighted average common shares outstanding – diluted ..................... 195,262 199,542
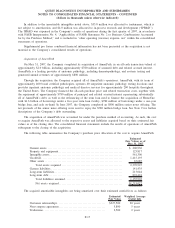
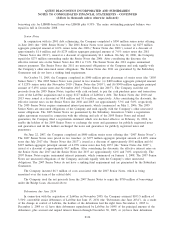
The unaudited pro forma combined financial information presented above reflects certain reclassifications to
the historical financial statements of AmeriPath to conform the acquired company’s accounting policies and
classification of certain costs and expenses to that of Quest Diagnostics. These adjustments had no impact on pro
forma net income. Pro forma results for the year ended December 31, 2007 exclude transaction related costs of
$44 million, which were incurred and expensed by AmeriPath in conjunction with its acquisition by Quest
Diagnostics.
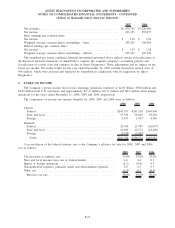
4. TAXES ON INCOME
The Company’s pretax income (loss) from continuing operations consisted of $1.02 billion, $920 million and
$1.02 billion from U.S. operations and approximately $(1.2) million, $(7.1) million and $8.6 million from foreign
operations for the years ended December 31, 2008, 2007 and 2006, respectively.
The components of income tax expense (benefit) for 2008, 2007 and 2006 were as follows:
2008 2007 2006
Current:
Federal . . ............................................................ $299,937 $267,138 $360,806
State and local....................................................... 57,750 59,625 93,292
Foreign. . ............................................................ 3,833 1,093 4,586
Deferred:
Federal . . ............................................................ 20,764 23,787 (26,897)
State and local....................................................... 10,029 10,774 (24,206)
Foreign. . ............................................................ (5,545) (3,843) -
Total. . ............................................................ $386,768 $358,574 $407,581
A reconciliation of the federal statutory rate to the Company’s effective tax rate for 2008, 2007 and 2006
was as follows:
2008 2007 2006
Tax provision at statutory rate .......................................... 35.0% 35.0% 35.0%
State and local income taxes, net of federal benefit ...................... 4.6 4.6 4.3
Impact of foreign operations ............................................ (1.1) (0.8) 0.3
Non-deductible expenses, primarily meals and entertainment expenses ..... 0.5 0.3 0.3
Other, net .............................................................. (1.0) 0.2 (0.5)
Effective tax rate..................................................... 38.0% 39.3% 39.4%
F-19
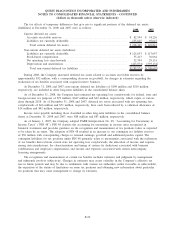
QUEST DIAGNOSTICS INCORPORATED AND SUBSIDIARIES
NOTES TO CONSOLIDATED FINANCIAL STATEMENTS - CONTINUED
(dollars in thousands unless otherwise indicated)