Quest Diagnostics 2008 Annual Report Download - page 110
Download and view the complete annual report
Please find page 110 of the 2008 Quest Diagnostics annual report below. You can navigate through the pages in the report by either clicking on the pages listed below, or by using the keyword search tool below to find specific information within the annual report.-
 1
1 -
2
-
3
-
4
-
5
-
6
-
7
-
8
-
9
-
10
-
11
-
12
-
13
-
14
-
15
-
16
-
17
-
18
-
19
-
20
-
21
-
22
-
23
-
24
-
25
-
26
-
27
-
28
-
29
-
30
-
31
-
32
-
33
-
34
-
35
-
36
-
37
-
38
-
39
-
40
-
41
-
42
-
43
-
44
-
45
-
46
-
47
-
48
-
49
-
50
-
51
-
52
-
53
-
54
-
55
-
56
-
57
-
58
-
59
-
60
-
61
-
62
-
63
-
64
-
65
-
66
-
67
-
68
-
69
-
70
-
71
-
72
-
73
-
74
-
75
-
76
-
77
-
78
-
79
-
80
-
81
-
82
-
83
-
84
-
85
-
86
-
87
-
88
-
89
-
90
-
91
-
92
-
93
-
94
-
95
-
96
-
97
-
98
-
99
-
 100
100 -
 101
101 -
 102
102 -
 103
103 -
 104
104 -
 105
105 -
 106
106 -
 107
107 -
 108
108 -
 109
109 -
 110
110 -
 111
111 -
 112
112 -
 113
113 -
 114
114 -
 115
115 -
 116
116 -
 117
117 -
 118
118 -
 119
119 -
 120
120 -
121
-
122
-
123
-
124
-
125
-
126
-
127
-
128
 |
 |

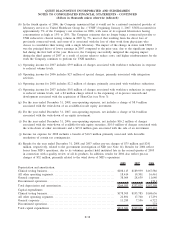
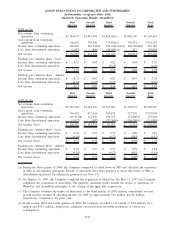
(b) In the fourth quarter of 2006, the Company announced that it would not be a national contracted provider of
laboratory services to United Healthcare Group Inc. (“UNH”) beginning January 1, 2007. UNH accounted for
approximately 7% of the Company’s net revenues in 2006, with some of its regional laboratories having
concentrations as high as 15% to 20%. The Company estimates that no longer being a contracted provider to
UNH reduced its clinical testing volume in 2007 by 7%, most of that resulting from the direct loss of
previously contracted work, and some of it associated with the loss of other work from physicians who
choose to consolidate their testing with a single laboratory. The impact of the change in status with UNH
was the principal driver of lower earnings in 2007 compared to the prior year, due to the significant impact it
had during the first half of the year. However, the Company successfully mitigated the ongoing impact
during the third quarter of 2007 as a result of actions taken to reduce costs, and higher reimbursement for the
work the Company continues to perform for UNH members.
(c) Operating income for 2007 includes $9.9 million of charges associated with workforce reductions in response
to reduced volume levels.
(d) Operating income for 2006 includes $27 million of special charges, primarily associated with integration
activities.
(e) Operating income for 2008 includes $2.2 million of charges, primarily associated with workforce reductions.
(f) Operating income for 2007 includes $0.8 million of charges associated with workforce reductions in response
to reduced volume levels, and a $4 million charge related to the expensing of in-process research and
development associated with the acquisition of HemoCue (see Note 3).
(g) For the year ended December 31, 2008, non-operating expenses, net includes a charge of $8.9 million
associated with the write-down of an available-for-sale equity investment.
(h) For the year ended December 31, 2007, non-operating expenses, net includes a charge of $4.0 million
associated with the write-down of an equity investment.
(i) For the year ended December 31, 2006, non-operating expenses, net includes $16.2 million of charges
associated with the write-down of available-for-sale equity securities, $10.0 million of charges associated with
the write-down of other investments and a $15.8 million gain associated with the sale of an investment.
(j) Income tax expense for 2008 includes a benefit of $16.5 million primarily associated with favorable
resolutions of certain tax contingencies.
(k) Results for the year ended December 31, 2008 and 2007 reflect pre-tax charges of $75 million and $241
million, respectively, related to the government investigation of NID (see Note 14). Results for 2006 reflect
losses from NID’s operations, due to its voluntary product hold instituted late in the second quarter of 2005
in connection with a quality review of all its products. In addition, results for 2006 also reflect pre-tax
charges of $32 million, primarily related to the wind down of NID’s operations.
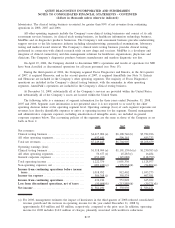
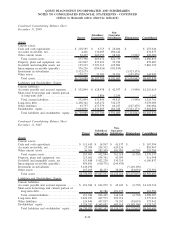
2008 2007 2006
Depreciation and amortization:
Clinical testing business. . ................................................... $208,115 $189,939 $167,586
All other operating segments ................................................ 18,414 19,301 16,461
General corporate........................................................... 38,064 28,639 11,640
Discontinued operations . . ................................................... - - 1,711
Total depreciation and amortization .......................................... $264,593 $237,879 $197,398
Capital expenditures:
Clinical testing business. . ................................................... $178,505 $193,785 $168,636
All other operating segments ................................................ 22,891 17,760 17,291
General corporate........................................................... 11,285 7,556 6,722
Discontinued operations . . ................................................... - - 773
Total capital expenditures ................................................... $212,681 $219,101 $193,422
F-38
QUEST DIAGNOSTICS INCORPORATED AND SUBSIDIARIES
NOTES TO CONSOLIDATED FINANCIAL STATEMENTS - CONTINUED
(dollars in thousands unless otherwise indicated)