Quest Diagnostics 2008 Annual Report Download - page 113
Download and view the complete annual report
Please find page 113 of the 2008 Quest Diagnostics annual report below. You can navigate through the pages in the report by either clicking on the pages listed below, or by using the keyword search tool below to find specific information within the annual report.-
 1
1 -
2
-
3
-
4
-
5
-
6
-
7
-
8
-
9
-
10
-
11
-
12
-
13
-
14
-
15
-
16
-
17
-
18
-
19
-
20
-
21
-
22
-
23
-
24
-
25
-
26
-
27
-
28
-
29
-
30
-
31
-
32
-
33
-
34
-
35
-
36
-
37
-
38
-
39
-
40
-
41
-
42
-
43
-
44
-
45
-
46
-
47
-
48
-
49
-
50
-
51
-
52
-
53
-
54
-
55
-
56
-
57
-
58
-
59
-
60
-
61
-
62
-
63
-
64
-
65
-
66
-
67
-
68
-
69
-
70
-
71
-
72
-
73
-
74
-
75
-
76
-
77
-
78
-
79
-
80
-
81
-
82
-
83
-
84
-
85
-
86
-
87
-
88
-
89
-
90
-
91
-
92
-
93
-
94
-
95
-
96
-
97
-
98
-
99
-
100
-
101
-
102
-
 103
103 -
 104
104 -
 105
105 -
 106
106 -
 107
107 -
 108
108 -
 109
109 -
 110
110 -
 111
111 -
 112
112 -
 113
113 -
 114
114 -
 115
115 -
 116
116 -
 117
117 -
 118
118 -
 119
119 -
 120
120 -
 121
121 -
 122
122 -
 123
123 -
124
-
125
-
126
-
127
-
128
 |
 |

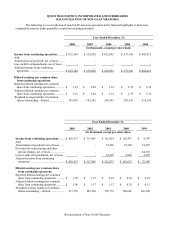
QUEST DIAGNOSTICS INCORPORATED AND SUBSIDIARIES
NOTES TO CONSOLIDATED FINANCIAL STATEMENTS - CONTINUED
(dollars in thousands unless otherwise indicated)
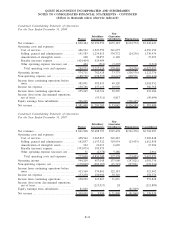
Condensed Consolidating Statement of Operations
For the Year Ended December 31, 2008
Parent
Subsidiary
Guarantors
Non-
Guarantor
Subsidiaries Eliminations Consolidated
Net revenues ................................ $ 829,484 $5,999,552 $653,183 $(232,772) $7,249,447
Operating costs and expenses:
Cost of services........................... 486,922 3,527,559 241,675 - 4,256,156
Selling, general and administrative ......... 191,583 1,234,815 334,772 (24,236) 1,736,934
Amortization of intangible assets........... 268 30,857 6,168 - 37,293
Royalty (income) expense . . . .............. (424,404) 424,404 - - -
Other operating expense (income), net ..... 404 (511) (3,205) - (3,312)
Total operating costs and expenses . ..... 254,773 5,217,124 579,410 (24,236) 6,027,071
Operating income ........................... 574,711 782,428 73,773 (208,536) 1,222,376
Non-operating expense, net .................. (188,720) (198,595) (24,645) 208,536 (203,424)
Income from continuing operations before
taxes ..................................... 385,991 583,833 49,128 - 1,018,952
Income tax expense . . ....................... 130,746 237,119 18,903 - 386,768
Income from continuing operations ........... 255,245 346,714 30,225 - 632,184
Income (loss) from discontinued operations,
net of taxes............................... - (55,511) 4,817 - (50,694)
Equity earnings from subsidiaries ............ 326,245 - - (326,245) -
Net income ................................. $ 581,490 $ 291,203 $ 35,042 $(326,245) $ 581,490
Condensed Consolidating Statement of Operations
For the Year Ended December 31, 2007
Parent
Subsidiary
Guarantors
Non-
Guarantor
Subsidiaries Eliminations Consolidated
Net revenues ................................ $ 821,908 $5,488,797 $715,478 $(321,276) $6,704,907
Operating costs and expenses:
Cost of services........................... 458,544 3,265,817 245,487 - 3,969,848
Selling, general and administrative ......... 162,857 1,153,522 319,934 (23,455) 1,612,858
Amortization of intangible assets........... 222 21,013 6,669 - 27,904
Royalty (income) expense . . . .............. (393,975) 393,975 - - -
Other operating expense (income), net ..... 51 (2,578) 5,488 - 2,961
Total operating costs and expenses . ..... 227,699 4,831,749 577,578 (23,455) 5,613,571
Operating income ........................... 594,209 657,048 137,900 (297,821) 1,091,336
Non-operating expense, net .................. (178,849) (282,187) (15,719) 297,821 (178,934)
Income from continuing operations before
taxes ..................................... 415,360 374,861 122,181 - 912,402
Income tax expense . . ....................... 157,270 150,994 50,310 - 358,574
Income from continuing operations ........... 258,090 223,867 71,871 - 553,828
Income (loss) from discontinued operations,
net of taxes............................... - (213,917) 28 - (213,889)
Equity earnings from subsidiaries ............ 81,849 - - (81,849) -
Net income ................................. $ 339,939 $ 9,950 $ 71,899 $ (81,849) $ 339,939
F-41