Quest Diagnostics 2008 Annual Report Download - page 47
Download and view the complete annual report
Please find page 47 of the 2008 Quest Diagnostics annual report below. You can navigate through the pages in the report by either clicking on the pages listed below, or by using the keyword search tool below to find specific information within the annual report.-
 1
1 -
2
-
3
-
4
-
5
-
6
-
7
-
8
-
9
-
10
-
11
-
12
-
13
-
14
-
15
-
16
-
17
-
18
-
19
-
20
-
21
-
22
-
23
-
24
-
25
-
26
-
27
-
28
-
29
-
30
-
31
-
32
-
33
-
34
-
35
-
36
-
 37
37 -
 38
38 -
 39
39 -
 40
40 -
 41
41 -
 42
42 -
 43
43 -
 44
44 -
 45
45 -
 46
46 -
 47
47 -
 48
48 -
 49
49 -
 50
50 -
 51
51 -
 52
52 -
 53
53 -
 54
54 -
 55
55 -
 56
56 -
 57
57 -
58
-
59
-
60
-
61
-
62
-
63
-
64
-
65
-
66
-
67
-
68
-
69
-
70
-
71
-
72
-
73
-
74
-
75
-
76
-
77
-
78
-
79
-
80
-
81
-
82
-
83
-
84
-
85
-
86
-
87
-
88
-
89
-
90
-
91
-
92
-
93
-
94
-
95
-
96
-
97
-
98
-
99
-
100
-
101
-
102
-
103
-
104
-
105
-
106
-
107
-
108
-
109
-
110
-
111
-
112
-
113
-
114
-
115
-
116
-
117
-
118
-
119
-
120
-
121
-
122
-
123
-
124
-
125
-
126
-
127
-
128
 |
 |
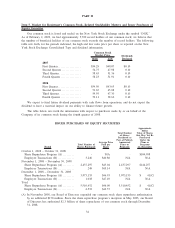
(B) Includes: (1) shares delivered or attested to in satisfaction of the exercise price and/or tax withholding
obligations by holders of employee stock options (granted under the Company’s Amended and Restated
Employee Long-Term Incentive Plan and its Amended and Restated Director Long-Term Incentive
Plan, collectively the “Stock Compensation Plans”) who exercised options; (2) restricted common
shares withheld (under the terms of grants under the Stock Compensation Plans) to offset tax
withholding obligations that occur upon vesting and release of the restricted common shares; and (3)
shares withheld (under the terms of grants under the Stock Compensation Plans) to offset tax
withholding obligations that occur upon the delivery of outstanding common shares underlying
restricted stock units and performance share units.
(C) In January 2009, our Board of Directors authorized the Company to repurchase an additional $500
million of the Company’s common stock. The share repurchase authorization has no set expiration or
termination date.
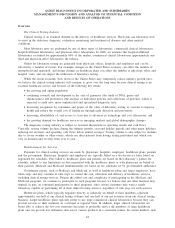
Performance Graph
Set forth below is a line graph comparing the cumulative total shareholder return on Quest
Diagnostics’ common stock since December 31, 2003, based on the market price of the Company’s
common stock and assuming reinvestment of dividends, with the cumulative total shareholder return of
companies on the Standard & Poor’s 500 Stock Index and the S&P 500 Healthcare Equipment & Services
Index.
Comparison of Cumulative Five Year Total Return
$0
$50
$100
$150
$200
S&P 500 Health Care Equipment & Services Index
S&P 500 Index
Quest Diagnostics, Inc.
200820072006200520042003
Date
Closing
DGX
Price(1) DGX S&P 500 S&P 500 H.C. DGX S&P 500 S&P 500 H.C.
Total Shareholder Return Performance Graph Values
12/31/2004......... $47.78 31.62% 10.88% 17.75% $131.62 $110.88 $117.75
12/31/2005......... $51.48 8.51% 4.91% 17.81% $142.82 $116.33 $138.72
12/31/2006......... $53.00 3.71% 15.79% 0.25% $148.11 $134.70 $139.07
12/31/2007......... $52.90 0.58% 5.49% 13.37% $148.96 $142.70 $157.66
12/31/2008......... $51.91 (1.08)% (37.00)% (37.27)% $147.35 $ 89.53 $ 98.90
(1) All values are adjusted to reflect the Company’s two-for-one stock split that occurred on June 20,
2005.
Item 6. Selected Financial Data
See page 40.
35