Quest Diagnostics 2008 Annual Report Download - page 114
Download and view the complete annual report
Please find page 114 of the 2008 Quest Diagnostics annual report below. You can navigate through the pages in the report by either clicking on the pages listed below, or by using the keyword search tool below to find specific information within the annual report.-
 1
1 -
2
-
3
-
4
-
5
-
6
-
7
-
8
-
9
-
10
-
11
-
12
-
13
-
14
-
15
-
16
-
17
-
18
-
19
-
20
-
21
-
22
-
23
-
24
-
25
-
26
-
27
-
28
-
29
-
30
-
31
-
32
-
33
-
34
-
35
-
36
-
37
-
38
-
39
-
40
-
41
-
42
-
43
-
44
-
45
-
46
-
47
-
48
-
49
-
50
-
51
-
52
-
53
-
54
-
55
-
56
-
57
-
58
-
59
-
60
-
61
-
62
-
63
-
64
-
65
-
66
-
67
-
68
-
69
-
70
-
71
-
72
-
73
-
74
-
75
-
76
-
77
-
78
-
79
-
80
-
81
-
82
-
83
-
84
-
85
-
86
-
87
-
88
-
89
-
90
-
91
-
92
-
93
-
94
-
95
-
96
-
97
-
98
-
99
-
100
-
101
-
102
-
103
-
 104
104 -
 105
105 -
 106
106 -
 107
107 -
 108
108 -
 109
109 -
 110
110 -
 111
111 -
 112
112 -
 113
113 -
 114
114 -
 115
115 -
 116
116 -
 117
117 -
 118
118 -
 119
119 -
 120
120 -
 121
121 -
 122
122 -
 123
123 -
 124
124 -
125
-
126
-
127
-
128
 |
 |

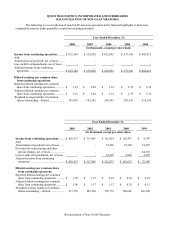
QUEST DIAGNOSTICS INCORPORATED AND SUBSIDIARIES
NOTES TO CONSOLIDATED FINANCIAL STATEMENTS - CONTINUED
(dollars in thousands unless otherwise indicated)
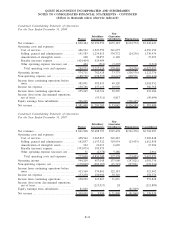
Condensed Consolidating Statement of Operations
For the Year Ended December 31, 2006
Parent
Subsidiary
Guarantors
Non-
Guarantor
Subsidiaries Eliminations Consolidated
Net revenues ................................ $ 942,692 $4,995,640 $710,692 $(380,365) $6,268,659
Operating costs and expenses:
Cost of services........................... 501,942 2,958,591 235,473 - 3,696,006
Selling, general and administrative ......... 147,862 1,020,774 264,488 (22,408) 1,410,716
Amortization of intangible assets........... 1,451 8,924 468 - 10,843
Royalty (income) expense . . . .............. (394,693) 394,693 - - -
Other operating (income) expense, net ..... (3,358) 24,704 1,671 - 23,017
Total operating costs and expenses . ..... 253,204 4,407,686 502,100 (22,408) 5,140,582
Operating income ........................... 689,488 587,954 208,592 (357,957) 1,128,077
Non-operating (expense) income, net ......... (160,244) (295,672) 3,155 357,957 (94,804)
Income from continuing operations before
taxes ..................................... 529,244 292,282 211,747 - 1,033,273
Income tax expense . . ....................... 201,426 118,441 87,714 - 407,581
Income from continuing operations ........... 327,818 173,841 124,033 - 625,692
Loss from discontinued operations, net of
taxes ..................................... - (28,980) (10,291) - (39,271)
Equity earnings from subsidiaries ............ 258,603 - - (258,603) -
Net income ................................. $ 586,421 $ 144,861 $113,742 $(258,603) $ 586,421
Condensed Consolidating Statement of Cash Flows
For the Year Ended December 31, 2008
Parent
Subsidiary
Guarantors
Non-
Guarantor
Subsidiaries Eliminations Consolidated
Cash flows from operating activities:
Net income ............................... $ 581,490 $ 291,203 $ 35,042 $(326,245) $ 581,490
Adjustments to reconcile net income to
net cash provided by (used in)
operating activities:
Depreciation and amortization ........... 53,116 193,975 17,502 - 264,593
Provision for doubtful accounts.......... 11,261 106,804 208,163 - 326,228
Provision for special charge ............. - 72,650 - - 72,650
Other, net .............................. (279,394) 56,698 10,638 326,245 114,187
Changes in operating assets and
liabilities............................. 462,768 (470,560) (288,307) - (296,099)
Net cash provided by (used in) operating
activities. ................................. 829,241 250,770 (16,962) - 1,063,049
Net cash (used in) provided by investing
activities. ................................. (144,149) (149,004) 14,137 80,133 (198,883)
Net cash used in financing activities . . . ...... (578,137) (109,898) (9,646) (80,133) (777,814)
Net change in cash and cash equivalents ..... 106,955 (8,132) (12,471) - 86,352
Cash and cash equivalents, beginning of
year ...................................... 111,610 14,847 41,137 - 167,594
Cash and cash equivalents, end of year. ...... $ 218,565 $ 6,715 $ 28,666 $ - $ 253,946
F-42