Quest Diagnostics 2008 Annual Report Download - page 75
Download and view the complete annual report
Please find page 75 of the 2008 Quest Diagnostics annual report below. You can navigate through the pages in the report by either clicking on the pages listed below, or by using the keyword search tool below to find specific information within the annual report.-
 1
1 -
2
-
3
-
4
-
5
-
6
-
7
-
8
-
9
-
10
-
11
-
12
-
13
-
14
-
15
-
16
-
17
-
18
-
19
-
20
-
21
-
22
-
23
-
24
-
25
-
26
-
27
-
28
-
29
-
30
-
31
-
32
-
33
-
34
-
35
-
36
-
37
-
38
-
39
-
40
-
41
-
42
-
43
-
44
-
45
-
46
-
47
-
48
-
49
-
50
-
51
-
52
-
53
-
54
-
55
-
56
-
57
-
58
-
59
-
60
-
61
-
62
-
63
-
64
-
 65
65 -
 66
66 -
 67
67 -
 68
68 -
 69
69 -
 70
70 -
 71
71 -
 72
72 -
 73
73 -
 74
74 -
 75
75 -
 76
76 -
 77
77 -
 78
78 -
 79
79 -
 80
80 -
 81
81 -
 82
82 -
 83
83 -
 84
84 -
 85
85 -
86
-
87
-
88
-
89
-
90
-
91
-
92
-
93
-
94
-
95
-
96
-
97
-
98
-
99
-
100
-
101
-
102
-
103
-
104
-
105
-
106
-
107
-
108
-
109
-
110
-
111
-
112
-
113
-
114
-
115
-
116
-
117
-
118
-
119
-
120
-
121
-
122
-
123
-
124
-
125
-
126
-
127
-
128
 |
 |

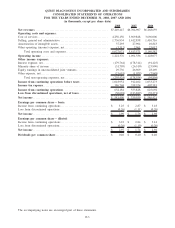
QUEST DIAGNOSTICS INCORPORATED AND SUBSIDIARIES
CONSOLIDATED STATEMENTS OF OPERATIONS
FOR THE YEARS ENDED DECEMBER 31, 2008, 2007 AND 2006
(in thousands, except per share data)
2008 2007 2006
Net revenues ......................................................... $7,249,447 $6,704,907 $6,268,659
Operating costs and expenses:
Cost of services ....................................................... 4,256,156 3,969,848 3,696,006
Selling, general and administrative ..................................... 1,736,934 1,612,858 1,410,716
Amortization of intangible assets . ...................................... 37,293 27,904 10,843
Other operating (income) expense, net .................................. (3,312) 2,961 23,017
Total operating costs and expenses................................. 6,027,071 5,613,571 5,140,582
Operating income .................................................... 1,222,376 1,091,336 1,128,077
Other income (expense):
Interest expense, net ................................................... (179,764) (178,314) (91,425)
Minority share of income .............................................. (31,705) (26,510) (23,900)
Equity earnings in unconsolidated joint ventures......................... 29,736 26,969 28,469
Other expense, net..................................................... (21,691) (1,079) (7,948)
Total non-operating expenses, net .................................. (203,424) (178,934) (94,804)
Income from continuing operations before taxes ...................... 1,018,952 912,402 1,033,273
Income tax expense................................................... 386,768 358,574 407,581
Income from continuing operations ................................... 632,184 553,828 625,692
Loss from discontinued operations, net of taxes....................... (50,694) (213,889) (39,271)
Net income ........................................................... $ 581,490 $ 339,939 $ 586,421
Earnings per common share – basic:
Income from continuing operations ..................................... $ 3.25 $ 2.87 $ 3.18
Loss from discontinued operations ...................................... (0.26) (1.11) (0.20)
Net income ........................................................... $ 2.99 $ 1.76 $ 2.98
Earnings per common share – diluted:
Income from continuing operations ..................................... $ 3.23 $ 2.84 $ 3.14
Loss from discontinued operations ...................................... (0.26) (1.10) (0.20)
Net income ........................................................... $ 2.97 $ 1.74 $ 2.94
Dividends per common share ......................................... $ 0.40 $ 0.40 $ 0.40
The accompanying notes are an integral part of these statements.
F-3