Quest Diagnostics 2008 Annual Report Download - page 2
Download and view the complete annual report
Please find page 2 of the 2008 Quest Diagnostics annual report below. You can navigate through the pages in the report by either clicking on the pages listed below, or by using the keyword search tool below to find specific information within the annual report.-
 1
1 -
 2
2 -
 3
3 -
 4
4 -
 5
5 -
 6
6 -
 7
7 -
 8
8 -
 9
9 -
 10
10 -
 11
11 -
 12
12 -
 13
13 -
14
-
15
-
16
-
17
-
18
-
19
-
20
-
21
-
22
-
23
-
24
-
25
-
26
-
27
-
28
-
29
-
30
-
31
-
32
-
33
-
34
-
35
-
36
-
37
-
38
-
39
-
40
-
41
-
42
-
43
-
44
-
45
-
46
-
47
-
48
-
49
-
50
-
51
-
52
-
53
-
54
-
55
-
56
-
57
-
58
-
59
-
60
-
61
-
62
-
63
-
64
-
65
-
66
-
67
-
68
-
69
-
70
-
71
-
72
-
73
-
74
-
75
-
76
-
77
-
78
-
79
-
80
-
81
-
82
-
83
-
84
-
85
-
86
-
87
-
88
-
89
-
90
-
91
-
92
-
93
-
94
-
95
-
96
-
97
-
98
-
99
-
100
-
101
-
102
-
103
-
104
-
105
-
106
-
107
-
108
-
109
-
110
-
111
-
112
-
113
-
114
-
115
-
116
-
117
-
118
-
119
-
120
-
121
-
122
-
123
-
124
-
125
-
126
-
127
-
128
 |
 |

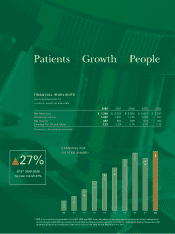
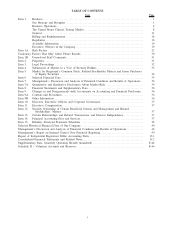
M27%
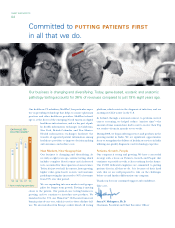
EPS* 1999-2008
10-year CAGR 27%
* EPS is from continuing operations. For 1999, 2000 and 2001 it was adjusted and excludes special charges and reflects adjustments
for the change in goodwill accounting. A reconciliation of these measures and the most directly comparable financial measures under
generally accepted accounting principles can be found in the 2008 Annual Report on Form 10-K.
2008 2007 2006 2005 2004
Net Revenues $ 7,249 $ 6,705 $ 6,269 $ 5,457 $ 5,067
Operating Income 1,222 1,091 1,128 1,008 881
Net Income 632 554 626 573 492
Earnings Per Diluted Share 3.23 2.84 3.14 2.79 2.32
Information is for continuing operations.
Year Ended December 31
in millions, except per share data
FINANCIAL HIGHLIGHTS
Patients Growth People
EARNINGS PER
DILUTED SHARE*
’99
$0.51
’00
$0.76
’01
$1.13
’02
$1.57
’03
$1.99
’04
$2.32
’05
$2.79
’06
$3.14
’07
$2.84
’08
$3.23