Quest Diagnostics 2008 Annual Report Download - page 76
Download and view the complete annual report
Please find page 76 of the 2008 Quest Diagnostics annual report below. You can navigate through the pages in the report by either clicking on the pages listed below, or by using the keyword search tool below to find specific information within the annual report.-
 1
1 -
2
-
3
-
4
-
5
-
6
-
7
-
8
-
9
-
10
-
11
-
12
-
13
-
14
-
15
-
16
-
17
-
18
-
19
-
20
-
21
-
22
-
23
-
24
-
25
-
26
-
27
-
28
-
29
-
30
-
31
-
32
-
33
-
34
-
35
-
36
-
37
-
38
-
39
-
40
-
41
-
42
-
43
-
44
-
45
-
46
-
47
-
48
-
49
-
50
-
51
-
52
-
53
-
54
-
55
-
56
-
57
-
58
-
59
-
60
-
61
-
62
-
63
-
64
-
65
-
 66
66 -
 67
67 -
 68
68 -
 69
69 -
 70
70 -
 71
71 -
 72
72 -
 73
73 -
 74
74 -
 75
75 -
 76
76 -
 77
77 -
 78
78 -
 79
79 -
 80
80 -
 81
81 -
 82
82 -
 83
83 -
 84
84 -
 85
85 -
 86
86 -
87
-
88
-
89
-
90
-
91
-
92
-
93
-
94
-
95
-
96
-
97
-
98
-
99
-
100
-
101
-
102
-
103
-
104
-
105
-
106
-
107
-
108
-
109
-
110
-
111
-
112
-
113
-
114
-
115
-
116
-
117
-
118
-
119
-
120
-
121
-
122
-
123
-
124
-
125
-
126
-
127
-
128
 |
 |

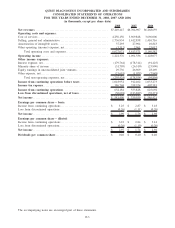
QUEST DIAGNOSTICS INCORPORATED AND SUBSIDIARIES
CONSOLIDATED STATEMENTS OF CASH FLOWS
FOR THE YEARS ENDED DECEMBER 31, 2008, 2007 AND 2006
(in thousands)
2008 2007 2006
Cash flows from operating activities:
Net income............................................................ $ 581,490 $ 339,939 $ 586,421
Adjustments to reconcile net income to net cash provided by operating
activities:
Depreciation and amortization .......................................... 264,593 237,879 197,398
Provision for doubtful accounts......................................... 326,228 300,226 243,443
Provision for restructuring and other special charges ..................... 72,650 238,781 55,788
Deferred income tax provision (benefit) ................................. 549 (1,575) (46,280)
Minority share of income . . ............................................ 31,705 26,510 23,900
Stock compensation expense............................................ 70,581 56,853 55,478
Excess tax benefits from stock-based compensation arrangements. ........ (2,420) (13,981) (32,693)
Other, net ............................................................. 13,772 8,310 20,172
Changes in operating assets and liabilities:
Accounts receivable . . . ............................................ (282,634) (265,347) (273,232)
Accounts payable and accrued expenses . . .......................... (4,342) (5,431) 81,347
Integration, settlement and other special charges . . . ................. (8,223) (14,013) (4,247)
Income taxes payable. . ............................................ 24,653 3,213 45,330
Other assets and liabilities, net. . ................................... (25,553) 15,560 (929)
Net cash provided by operating activities ............................. 1,063,049 926,924 951,896
Cash flows from investing activities:
Business acquisitions, net of cash acquired .............................. 8,066 (1,535,826) (236,543)
Capital expenditures ................................................... (212,681) (219,101) (193,422)
Decrease (increase) in investments and other assets ...................... 5,732 (4,266) 15,563
Net cash used in investing activities................................... (198,883) (1,759,193) (414,402)
Cash flows from financing activities:
Proceeds from borrowings. . ............................................ 22,929 3,754,490 375,000
Repayments of debt.................................................... (481,870) (2,705,369) (416,208)
Increase (decrease) in book overdrafts .................................. 14,201 (24,950) (1,705)
Purchases of treasury stock. ............................................ (253,997) (145,660) (472,325)
Exercise of stock options. . . ............................................ 30,511 80,928 102,324
Excess tax benefits from stock-based compensation arrangements. ........ 2,420 13,981 32,693
Dividends paid . . . ..................................................... (77,964) (77,327) (77,135)
Distributions to minority partners ....................................... (32,931) (24,678) (21,900)
Financing costs paid ................................................... (1,113) (21,192) (728)
Net cash (used in) provided by financing activities .................... (777,814) 850,223 (479,984)
Net change in cash and cash equivalents .............................. 86,352 17,954 57,510
Cash and cash equivalents, beginning of year ......................... 167,594 149,640 92,130
Cash and cash equivalents, end of year ............................... $ 253,946 $ 167,594 $ 149,640
The accompanying notes are an integral part of these statements.
F-4