Quest Diagnostics 2008 Annual Report Download - page 61
Download and view the complete annual report
Please find page 61 of the 2008 Quest Diagnostics annual report below. You can navigate through the pages in the report by either clicking on the pages listed below, or by using the keyword search tool below to find specific information within the annual report.-
 1
1 -
2
-
3
-
4
-
5
-
6
-
7
-
8
-
9
-
10
-
11
-
12
-
13
-
14
-
15
-
16
-
17
-
18
-
19
-
20
-
21
-
22
-
23
-
24
-
25
-
26
-
27
-
28
-
29
-
30
-
31
-
32
-
33
-
34
-
35
-
36
-
37
-
38
-
39
-
40
-
41
-
42
-
43
-
44
-
45
-
46
-
47
-
48
-
49
-
50
-
 51
51 -
 52
52 -
 53
53 -
 54
54 -
 55
55 -
 56
56 -
 57
57 -
 58
58 -
 59
59 -
 60
60 -
 61
61 -
 62
62 -
 63
63 -
 64
64 -
 65
65 -
 66
66 -
 67
67 -
 68
68 -
 69
69 -
 70
70 -
 71
71 -
72
-
73
-
74
-
75
-
76
-
77
-
78
-
79
-
80
-
81
-
82
-
83
-
84
-
85
-
86
-
87
-
88
-
89
-
90
-
91
-
92
-
93
-
94
-
95
-
96
-
97
-
98
-
99
-
100
-
101
-
102
-
103
-
104
-
105
-
106
-
107
-
108
-
109
-
110
-
111
-
112
-
113
-
114
-
115
-
116
-
117
-
118
-
119
-
120
-
121
-
122
-
123
-
124
-
125
-
126
-
127
-
128
 |
 |
current period. We periodically obtain and review publicly available financial information for the members of the
peer group and compare that to actual and estimated future performance of the Company, including historical
earnings per share growth as well as published estimates of projected earnings per share growth. This information
is used to evaluate our progress towards achieving the performance criteria and our estimate of the number of
performance share units expected to be earned at the end of the performance period. The cumulative effect on
current and prior periods of a change in the estimated number of performance share units expected to be earned
is recognized as compensation cost in earnings in the period of the revision. While the assumptions used to
calculate and account for stock-based compensation awards represent management’s best estimates, these
estimates involve inherent uncertainties and the application of management’s judgment. As a result, if revisions
are made to our assumptions and estimates, our stock-based compensation expense could vary significantly from
period to period. In addition, the number of awards made under our equity compensation plans, changes in the
design of those plans, the price of our shares and the performance of our Company can all cause stock-based
compensation expense to vary from period to period.
Results of Operations
Our clinical testing business currently represents our one reportable business segment. The clinical testing
business for each of the three years in the period ended December 31, 2008 accounted for more than 90% of net
revenues from continuing operations. Our other operating segments consist of our risk assessment services
business, our clinical trials testing business, our healthcare information technology business, MedPlus, and our
diagnostic products business. On April 19, 2006, we decided to discontinue the operations of a test kit
manufacturing subsidiary, NID. During the third quarter of 2006, we completed the wind down of NID and
classified the operations of NID as discontinued operations for all periods presented. Our business segment
information is disclosed in Note 16 to the Consolidated Financial Statements.
Year Ended December 31, 2008 Compared with Year Ended December 31, 2007
Continuing Operations
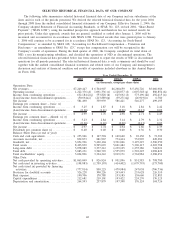
Income from continuing operations for the year ended December 31, 2008 was $632 million, or $3.23 per
diluted share, compared to $554 million, or $2.84 per diluted share, in 2007. The increase in income from
continuing operations was principally driven by revenue growth and actions we have taken to reduce our cost
structure.
Results for the year ended December 31, 2008 include charges totaling $25.1 million, or $0.08 per diluted
share consisting of: a third quarter charge of $8.9 million, or $0.03 per diluted share, associated with the write-
down of an equity investment; and a fourth quarter charge of $16.2 million, or $0.05 per diluted share,
principally associated with workforce reductions. These charges were offset in part by favorable resolutions of
certain tax contingencies in 2008, which increased diluted earnings per share by $0.08.
In addition, for 2008 we estimate the impact of hurricanes in the third quarter of 2008 reduced the increase
in operating income for the year ended December 31, 2008 by approximately $8 million or $0.02 per diluted
share, compared to the prior year.
During the first quarter of 2007, we became a non-contracted provider to United Healthcare Group Inc.,
(“UNH”). As a result of the change in status, our revenues and earnings were significantly impacted for the first
quarter and full year 2007. However, the ongoing profit impact was successfully mitigated by the end of 2007 as
a result of our actions to reduce costs, and higher reimbursement for the testing we continued to perform for
UNH members as a non-contracted provider.
Results for the year ended December 31, 2007 include first quarter pre-tax charges of $10.7 million, or
$0.03 per diluted share, associated with workforce reductions in response to reduced volume levels, and a first
quarter pre-tax charge of $4.0 million, or $0.01 per diluted share, related to in-process research and development
expense associated with the HemoCue acquisition.
Net Revenues
Net revenues for the year ended December 31, 2008 grew by 8.1% over the prior year level to $7.2 billion,
with the carry-over impact from the 2007 acquisition of AmeriPath contributing approximately 5.0% to revenue
growth in 2008.
For 2008, revenues of our clinical testing business, which accounts for over 90% of our net revenues, grew
8.3% above the prior year level, with AmeriPath contributing 5.5% growth. Volume, measured by the number of
49