Quest Diagnostics 2008 Annual Report Download - page 46
Download and view the complete annual report
Please find page 46 of the 2008 Quest Diagnostics annual report below. You can navigate through the pages in the report by either clicking on the pages listed below, or by using the keyword search tool below to find specific information within the annual report.-
 1
1 -
2
-
3
-
4
-
5
-
6
-
7
-
8
-
9
-
10
-
11
-
12
-
13
-
14
-
15
-
16
-
17
-
18
-
19
-
20
-
21
-
22
-
23
-
24
-
25
-
26
-
27
-
28
-
29
-
30
-
31
-
32
-
33
-
34
-
35
-
 36
36 -
 37
37 -
 38
38 -
 39
39 -
 40
40 -
 41
41 -
 42
42 -
 43
43 -
 44
44 -
 45
45 -
 46
46 -
 47
47 -
 48
48 -
 49
49 -
 50
50 -
 51
51 -
 52
52 -
 53
53 -
 54
54 -
 55
55 -
 56
56 -
57
-
58
-
59
-
60
-
61
-
62
-
63
-
64
-
65
-
66
-
67
-
68
-
69
-
70
-
71
-
72
-
73
-
74
-
75
-
76
-
77
-
78
-
79
-
80
-
81
-
82
-
83
-
84
-
85
-
86
-
87
-
88
-
89
-
90
-
91
-
92
-
93
-
94
-
95
-
96
-
97
-
98
-
99
-
100
-
101
-
102
-
103
-
104
-
105
-
106
-
107
-
108
-
109
-
110
-
111
-
112
-
113
-
114
-
115
-
116
-
117
-
118
-
119
-
120
-
121
-
122
-
123
-
124
-
125
-
126
-
127
-
128
 |
 |

PART II
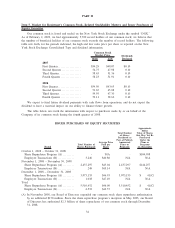
Item 5. Market for Registrant’s Common Stock, Related Stockholder Matters and Issuer Purchases of
Equity Securities
Our common stock is listed and traded on the New York Stock Exchange under the symbol “DGX.”
As of February 2, 2009, we had approximately 5,700 record holders of our common stock; we believe that
the number of beneficial holders of our common stock exceeds the number of record holders. The following
table sets forth, for the periods indicated, the high and low sales price per share as reported on the New
York Stock Exchange Consolidated Tape and dividend information.
High Low
Dividends
Declared
Common Stock
Market Price
2007
First Quarter .................. $54.29 $48.07 $0.10
Second Quarter ............... 54.75 47.98 0.10
Third Quarter ................. 58.63 51.36 0.10
Fourth Quarter ................ 58.23 51.91 0.10
2008
First Quarter .................. $54.50 $43.65 $0.10
Second Quarter ............... 51.65 45.08 0.10
Third Quarter ................. 59.95 47.30 0.10
Fourth Quarter ................ 52.11 38.66 0.10
We expect to fund future dividend payments with cash flows from operations, and do not expect the
dividend to have a material impact on our ability to finance future growth.
The table below sets forth the information with respect to purchases made by or on behalf of the
Company of its common stock during the fourth quarter of 2008.
ISSUER PURCHASES OF EQUITY SECURITIES
Period
Total Number of
Shares Purchased
Average Price
Paid per
Share
Total Number
of Shares
Purchased as
Part of Publicly
Announced
Plans or
Programs
Approximate
Dollar
Value of Shares
that May Yet Be
Purchased
Under the
Plans or
Programs
(in thousands)
October 1, 2008 – October 31, 2008
Share Repurchase Program (A) ......... - N/A - $104,038
Employee Transactions (B) . . . .......... 3,246 $40.80 N/A N/A
November 1, 2008 – November 30, 2008
Share Repurchase Program (A) ......... 2,437,297 $45.04 2,437,297 $144,257
Employee Transactions (B) . . . .......... 249 $45.14 N/A N/A
December 1, 2008 – December 31, 2008
Share Repurchase Program (A) ......... 3,073,155 $46.93 3,073,155 $ 41(C)
Employee Transactions (B) . . . .......... 1,038 $47.49 N/A N/A
Total
Share Repurchase Program (A) ......... 5,510,452 $46.09 5,510,452 $ 41(C)
Employee Transactions (B) . . . .......... 4,533 $42.57 N/A N/A
(A) In November 2008, our Board of Directors expanded our common stock share repurchase authorization
by an additional $150 million. Since the share repurchase program’s inception in May 2003, our Board
of Directors has authorized $2.3 billion of share repurchases of our common stock through December
31, 2008.
34