Quest Diagnostics 2008 Annual Report Download - page 79
Download and view the complete annual report
Please find page 79 of the 2008 Quest Diagnostics annual report below. You can navigate through the pages in the report by either clicking on the pages listed below, or by using the keyword search tool below to find specific information within the annual report.-
 1
1 -
2
-
3
-
4
-
5
-
6
-
7
-
8
-
9
-
10
-
11
-
12
-
13
-
14
-
15
-
16
-
17
-
18
-
19
-
20
-
21
-
22
-
23
-
24
-
25
-
26
-
27
-
28
-
29
-
30
-
31
-
32
-
33
-
34
-
35
-
36
-
37
-
38
-
39
-
40
-
41
-
42
-
43
-
44
-
45
-
46
-
47
-
48
-
49
-
50
-
51
-
52
-
53
-
54
-
55
-
56
-
57
-
58
-
59
-
60
-
61
-
62
-
63
-
64
-
65
-
66
-
67
-
68
-
 69
69 -
 70
70 -
 71
71 -
 72
72 -
 73
73 -
 74
74 -
 75
75 -
 76
76 -
 77
77 -
 78
78 -
 79
79 -
 80
80 -
 81
81 -
 82
82 -
 83
83 -
 84
84 -
 85
85 -
 86
86 -
 87
87 -
 88
88 -
 89
89 -
90
-
91
-
92
-
93
-
94
-
95
-
96
-
97
-
98
-
99
-
100
-
101
-
102
-
103
-
104
-
105
-
106
-
107
-
108
-
109
-
110
-
111
-
112
-
113
-
114
-
115
-
116
-
117
-
118
-
119
-
120
-
121
-
122
-
123
-
124
-
125
-
126
-
127
-
128
 |
 |

settlement. In 2008, 2007 and 2006, approximately 18%, 17% and 17%, respectively, of the Company’s net
revenues were generated by Medicare and Medicaid programs. Under capitated arrangements with healthcare
plans, the Company recognizes revenue based on a predetermined monthly reimbursement rate for each member
of an insurer’s health plan regardless of the number or cost of services provided by the Company.
Taxes on Income
The Company uses the asset and liability approach to account for income taxes. Under this method, deferred
tax assets and liabilities are recognized for the expected future tax consequences of differences between the
carrying amounts of assets and liabilities and their respective tax bases using tax rates in effect for the year in
which the differences are expected to reverse. A valuation allowance is provided when it is more likely than not
that some portion or all of the deferred tax assets will not be realized. The effect on deferred tax assets and
liabilities of a change in tax rates is recognized in income in the period when the change is enacted.
On January 1, 2007, the Company adopted FASB Interpretation No. 48 “Accounting for Uncertainty in
Income Taxes” (“FIN 48”). FIN 48 clarifies the accounting for uncertainty in income taxes recognized in
financial statements in accordance with Statement of Financial Accounting Standards (“SFAS”) No. 109
“Accounting for Income Taxes.” FIN 48 provides guidance on recognizing, measuring, presenting and disclosing
in the financial statements uncertain tax positions that a company has taken or expects to take on a tax return.
See Note 4 for further information related to FIN 48.
Earnings Per Share
Basic earnings per common share is calculated by dividing net income by the weighted average common
shares outstanding. Diluted earnings per common share is calculated by dividing net income by the weighted
average common shares outstanding after giving effect to all potentially dilutive common shares outstanding
during the period. Potentially dilutive common shares include the dilutive effect of outstanding stock options,
performance share units, restricted common shares and restricted stock units granted under the Company’s
Amended and Restated Employee Long-Term Incentive Plan and its Amended and Restated Director Long-Term
Incentive Plan.
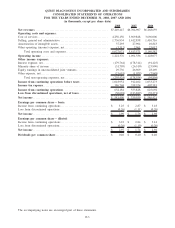
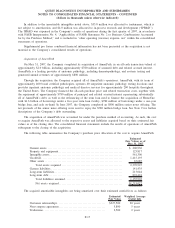
The computation of basic and diluted earnings per common share was as follows (in thousands, except per
share data):
2008 2007 2006
Income from continuing operations ................................ $632,184 $ 553,828 $625,692
Loss from discontinued operations . ................................ (50,694) (213,889) (39,271)
Net income available to common stockholders...................... $581,490 $ 339,939 $586,421
Weighted average common shares outstanding – basic .............. 194,283 193,241 196,985
Effect of dilutive securities:
Stock options . . ................................................... 1,675 2,019 2,535
Restricted common shares, restricted stock units and performance
share units . . ................................................... 1 2 22
Weighted average common shares outstanding – diluted ............ 195,959 195,262 199,542
Earnings per common share – basic:
Income from continuing operations ................................ $ 3.25 $ 2.87 $ 3.18
Loss from discontinued operations . ................................ (0.26) (1.11) (0.20)
Net income....................................................... $ 2.99 $ 1.76 $ 2.98
Earnings per common share – diluted:
Income from continuing operations ................................ $ 3.23 $ 2.84 $ 3.14
Loss from discontinued operations . ................................ (0.26) (1.10) (0.20)
Net income....................................................... $ 2.97 $ 1.74 $ 2.94
F-7
QUEST DIAGNOSTICS INCORPORATED AND SUBSIDIARIES
NOTES TO CONSOLIDATED FINANCIAL STATEMENTS - CONTINUED
(dollars in thousands unless otherwise indicated)