Pep Boys 2014 Annual Report Download - page 8
Download and view the complete annual report
Please find page 8 of the 2014 Pep Boys annual report below. You can navigate through the pages in the report by either clicking on the pages listed below, or by using the keyword search tool below to find specific information within the annual report.-
 1
1 -
 2
2 -
 3
3 -
 4
4 -
 5
5 -
 6
6 -
 7
7 -
 8
8 -
 9
9 -
 10
10 -
 11
11 -
 12
12 -
 13
13 -
 14
14 -
 15
15 -
 16
16 -
 17
17 -
 18
18 -
 19
19 -
20
-
21
-
22
-
23
-
24
-
25
-
26
-
27
-
28
-
29
-
30
-
31
-
32
-
33
-
34
-
35
-
36
-
37
-
38
-
39
-
40
-
41
-
42
-
43
-
44
-
45
-
46
-
47
-
48
-
49
-
50
-
51
-
52
-
53
-
54
-
55
-
56
-
57
-
58
-
59
-
60
-
61
-
62
-
63
-
64
-
65
-
66
-
67
-
68
-
69
-
70
-
71
-
72
-
73
-
74
-
75
-
76
-
77
-
78
-
79
-
80
-
81
-
82
-
83
-
84
-
85
-
86
-
87
-
88
-
89
-
90
-
91
-
92
 |
 |

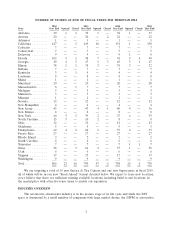
NUMBER OF STORES AT END OF FISCAL YEARS 2011 THROUGH 2014
2014 2013 2012 2011
State Year End Opened Closed Year End Opened Closed Year End Opened Closed Year End
Alabama ......... 39 1 1 39 1 — 38 1 — 37
Arizona .......... 20 —— 20 — 222—— 22
Arkansas ......... 1 —— 1—— 1—— 1
California ......... 147 — 2 149 18 — 131 1 — 130
Colorado ......... 7 —— 7—— 7—— 7
Connecticut ....... 7 —— 7—— 7—— 7
Delaware ......... 9 —— 9—— 91— 8
Florida ........... 102 5 1 98 7 — 91 5 4 90
Georgia .......... 49 4 2 47 1 3 49 3 1 47
Illinois ........... 38 1 1 38 3 — 35 3 — 32
Indiana .......... 7 —— 7—— 7—— 7
Kentucky ......... 3 —14—— 4—— 4
Louisiana ......... 8 —— 8—— 8—— 8
Maine ........... 1 —— 1—— 1—— 1
Maryland ......... 20 —— 20 —— 20 —— 20
Massachusetts ...... 6 —17—— 7—— 7
Michigan ......... 5 —— 5—— 5—— 5
Minnesota ........ 3 —— 3—— 3—— 3
Missouri .......... 1 —— 1—— 1—— 1
Nevada ........... 12 —— 12 —— 12 —— 12
New Hampshire .... 4 —— 4—— 4—— 4
New Jersey ........ 43 —— 43 4 1 40 4 — 36
New Mexico ....... 8 —— 8—— 8—— 8
New York ......... 40 3 2 39 2 — 37 4 — 33
North Carolina ..... 15 5 — 10 2 — 8 —— 8
Ohio ............ 12 —— 12 —— 12 —— 12
Oklahoma ........ 5 —— 5—— 5—— 5
Pennsylvania ....... 62 4 2 60 5 — 55 2 — 53
Puerto Rico ....... 27 —— 27 —— 27 —— 27
Rhode Island ...... 2 —— 2—— 2—— 2
South Carolina ..... 6 —— 6—— 6—— 6
Tennessee ......... 7 —— 7—— 711 7
Texas ............ 58 —361 4— 57 1 — 56
Utah ............ 6 —— 6—— 6—— 6
Virginia .......... 17 —— 17 —— 17 —— 17
Washington ........ 9 —— 9—— 9—— 9
Total ............ 806 23 16 799 47 6 758 26 6 738
We are targeting a total of 15 new Service & Tire Centers and one new Supercenter in fiscal 2015,
all of which will be in our new ‘‘Road Ahead’’ format detailed below. We expect to lease new locations,
as we believe that there are sufficient existing available locations, including build to suit locations, in
the marketplace with attractive lease terms to enable our expansion.
INDUSTRY OVERVIEW
The automotive aftermarket industry is in the mature stage of its life cycle and while the DIY
space is dominated by a small number of companies with large market shares, the DIFM or automotive
2