Pep Boys 2014 Annual Report Download - page 74
Download and view the complete annual report
Please find page 74 of the 2014 Pep Boys annual report below. You can navigate through the pages in the report by either clicking on the pages listed below, or by using the keyword search tool below to find specific information within the annual report.-
 1
1 -
2
-
3
-
4
-
5
-
6
-
7
-
8
-
9
-
10
-
11
-
12
-
13
-
14
-
15
-
16
-
17
-
18
-
19
-
20
-
21
-
22
-
23
-
24
-
25
-
26
-
27
-
28
-
29
-
30
-
31
-
32
-
33
-
34
-
35
-
36
-
37
-
38
-
39
-
40
-
41
-
42
-
43
-
44
-
45
-
46
-
47
-
48
-
49
-
50
-
51
-
52
-
53
-
54
-
55
-
56
-
57
-
58
-
59
-
60
-
61
-
62
-
63
-
 64
64 -
 65
65 -
 66
66 -
 67
67 -
 68
68 -
 69
69 -
 70
70 -
 71
71 -
 72
72 -
 73
73 -
 74
74 -
 75
75 -
 76
76 -
 77
77 -
 78
78 -
 79
79 -
 80
80 -
 81
81 -
 82
82 -
 83
83 -
 84
84 -
85
-
86
-
87
-
88
-
89
-
90
-
91
-
92
 |
 |

THE PEP BOYS—MANNY, MOE & JACK AND SUBSIDIARIES
NOTES TO CONSOLIDATED FINANCIAL STATEMENTS (Continued)
Years ended January 31, 2015, February 1, 2014 and February 2, 2013
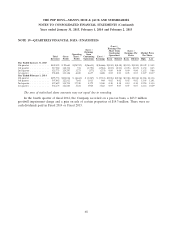
NOTE 19—QUARTERLY FINANCIAL DATA (UNAUDITED)
(Loss) /
Earnings Per
(Loss) / Share from (Loss) /
Earnings Continuing Earnings Per Market Price
Operating from Operations Share Per Share
Total Gross (Loss) / Continuing (Loss) /
Revenues Profit Profit Operations Earnings Basic Diluted Basic Diluted High Low
Year Ended January 31, 2015
4th quarter ............ $502,423 $ 99,685 $(28,752) $(26,653) $(26,666) $(0.50) $(0.50) $(0.50) $(0.50) $10.09 $ 8.43
3rd quarter ............ 517,584 118,334 574 (1,770) (1,964) (0.03) (0.03) (0.03) (0.03) 11.52 8.45
2nd quarter ............ 525,773 124,297 3,273 (177) (273) 0.00 0.00 0.00 0.00 11.52 9.86
1st quarter ............ 538,821 133,126 6,045 1,637 1,608 0.03 0.03 0.03 0.03 13.27 10.17
Year Ended February 1, 2014
4th quarter ............ $495,733 $104,016 $ (6,614) $ (3,267) $ (3,331) $(0.06) $(0.06) $(0.06) $(0.06) $13.86 $11.36
3rd quarter ............ 507,042 122,812 7,641 1,013 964 0.02 0.02 0.02 0.02 13.05 11.01
2nd quarter ............ 527,619 138,708 17,748 5,379 5,368 0.10 0.10 0.10 0.10 12.94 11.14
1st quarter ............ 536,173 121,840 3,521 3,928 3,863 0.07 0.07 0.07 0.07 12.14 10.29
The sum of individual share amounts may not equal due to rounding.
In the fourth quarter of fiscal 2014, the Company recorded on a pre-tax basis, a $23.9 million
goodwill impairment charge and a gain on sale of certain properties of $14.3 million. There were no
cash dividends paid in Fiscal 2014 or Fiscal 2013.
68