Pep Boys 2014 Annual Report Download - page 65
Download and view the complete annual report
Please find page 65 of the 2014 Pep Boys annual report below. You can navigate through the pages in the report by either clicking on the pages listed below, or by using the keyword search tool below to find specific information within the annual report.-
 1
1 -
2
-
3
-
4
-
5
-
6
-
7
-
8
-
9
-
10
-
11
-
12
-
13
-
14
-
15
-
16
-
17
-
18
-
19
-
20
-
21
-
22
-
23
-
24
-
25
-
26
-
27
-
28
-
29
-
30
-
31
-
32
-
33
-
34
-
35
-
36
-
37
-
38
-
39
-
40
-
41
-
42
-
43
-
44
-
45
-
46
-
47
-
48
-
49
-
50
-
51
-
52
-
53
-
54
-
 55
55 -
 56
56 -
 57
57 -
 58
58 -
 59
59 -
 60
60 -
 61
61 -
 62
62 -
 63
63 -
 64
64 -
 65
65 -
 66
66 -
 67
67 -
 68
68 -
 69
69 -
 70
70 -
 71
71 -
 72
72 -
 73
73 -
 74
74 -
 75
75 -
76
-
77
-
78
-
79
-
80
-
81
-
82
-
83
-
84
-
85
-
86
-
87
-
88
-
89
-
90
-
91
-
92
 |
 |

THE PEP BOYS—MANNY, MOE & JACK AND SUBSIDIARIES
NOTES TO CONSOLIDATED FINANCIAL STATEMENTS (Continued)
Years ended January 31, 2015, February 1, 2014 and February 2, 2013
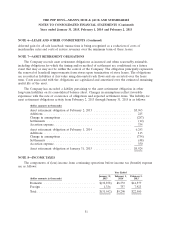
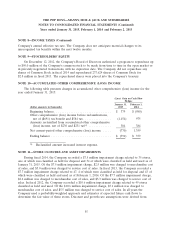
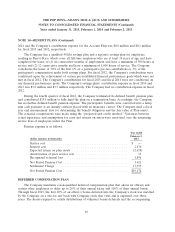
NOTE 13—EARNINGS PER SHARE
The following schedule presents the calculation of basic and diluted earnings per share for
earnings from continuing operations:
Year Ended
January 31, February 1, February 2,
2015 2014 2013
(dollar amounts in thousands, except per share amounts)
(a) (Loss)earnings from continuing operations before
discontinued operations .......................... $(26,961) $ 7,053 $13,155
Loss from discontinued operations, net of tax benefit of $179,
$102 and $186 ................................. (332) (188) (345)
Net (loss) earnings ................................ $(27,293) $ 6,865 $12,810
(b) Basic average number of common shares outstanding during
period ....................................... 53,608 53,378 53,225
Common shares assumed issued upon exercise of dilutive
equity awards, net of assumed repurchase, at the average
market price ................................... — 585 729
(c) Diluted average number of common shares assumed
outstanding during period ......................... 53,608 53,963 53,954
Basic earnings per share:
Earnings from continuing operations (a/b) ............... $ (0.50) $ 0.13 $ 0.25
Discontinued operations, net of tax .................... (0.01) —(0.01)
Basic earnings per share ............................ $ (0.51) $ 0.13 $ 0.24
Diluted earnings per share:
Earnings from continuing operations (a/c) ............... $ (0.50) $ 0.13 $ 0.24
Discontinued operations, net of tax .................... (0.01) ——
Diluted earnings per share .......................... $ (0.51) $ 0.13 $ 0.24
Certain stock options were excluded from the calculations of diluted earnings per share because
their exercise prices were greater than the average market price of the common shares for the period
then ended and therefore would be anti-dilutive. The total number of stock options, restricted stock
units and performance share units excluded from the diluted earnings per share calculation was
2,407,000; 937,000; and 859,000 as of January 31, 2015, February 1, 2014, and February 2, 2013,
respectively.
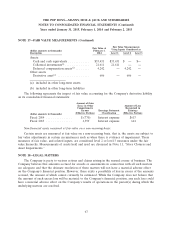
NOTE 14—BENEFIT PLANS
DEFINED BENEFIT AND CONTRIBUTION PLANS
On January 31, 2014, the Company’s non-qualified defined contribution Supplemental Executive
Retirement Plan (the ‘‘Account Plan’’) for key employees designated by the Board of Directors was
amended to eliminate the retirement plan contributions that have historically been made by the
Company effective for calendar year 2015. The Company did not contribute to the Account Plan in
59