Pep Boys 2014 Annual Report Download - page 32
Download and view the complete annual report
Please find page 32 of the 2014 Pep Boys annual report below. You can navigate through the pages in the report by either clicking on the pages listed below, or by using the keyword search tool below to find specific information within the annual report.-
 1
1 -
2
-
3
-
4
-
5
-
6
-
7
-
8
-
9
-
10
-
11
-
12
-
13
-
14
-
15
-
16
-
17
-
18
-
19
-
20
-
21
-
 22
22 -
 23
23 -
 24
24 -
 25
25 -
 26
26 -
 27
27 -
 28
28 -
 29
29 -
 30
30 -
 31
31 -
 32
32 -
 33
33 -
 34
34 -
 35
35 -
 36
36 -
 37
37 -
 38
38 -
 39
39 -
 40
40 -
 41
41 -
 42
42 -
43
-
44
-
45
-
46
-
47
-
48
-
49
-
50
-
51
-
52
-
53
-
54
-
55
-
56
-
57
-
58
-
59
-
60
-
61
-
62
-
63
-
64
-
65
-
66
-
67
-
68
-
69
-
70
-
71
-
72
-
73
-
74
-
75
-
76
-
77
-
78
-
79
-
80
-
81
-
82
-
83
-
84
-
85
-
86
-
87
-
88
-
89
-
90
-
91
-
92
 |
 |

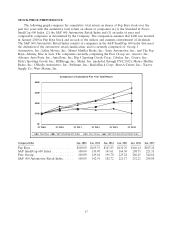
commercial sales business. Our Service Center business competes in the Service area of the industry.
The following table presents the revenues and gross profit for each area of the business.
Fiscal Year ended
January 31, February 1, February 2,
(dollar amounts in thousands) 2015 2014 2013
Service center revenue(1) ................ $1,151,575 $1,110,958 $1,095,284
Retail sales(2) ........................ 933,028 955,610 995,446
Total revenues ....................... $2,084,603 $2,066,568 $2,090,730
Gross profit from service center revenue(3) . . . $ 230,130 $ 209,853 $ 208,795
Gross profit from retail sales(4) ............ 245,314 277,524 282,705
Total gross profit ...................... $ 475,444 $ 487,377 $ 491,500
(1) Includes revenues from installed products.
(2) Excludes revenues from installed products.
(3) Gross profit from service center revenue includes the cost of installed products sold,
buying, warehousing, service center payroll and related employee benefits and service
center occupancy costs. Occupancy costs include utilities, rents, real estate and property
taxes, repairs and maintenance and depreciation and amortization expenses.
(4) Gross profit from retail sales includes the cost of products sold, buying, warehousing and
store occupancy costs. Occupancy costs include utilities, rents, real estate and property
taxes, repairs and maintenance and depreciation and amortization expenses.
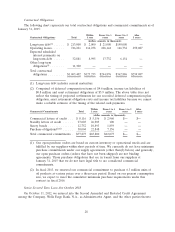
CAPITAL & LIQUIDITY
Capital Resources and Needs
Our cash requirements arise principally from (i) the purchase of inventory and capital expenditures
related to existing and new stores, offices and distribution centers, (ii) debt service and (iii) contractual
obligations. Cash flows realized through the sale of automotive services, tires, parts and accessories are
our primary source of liquidity. Net cash provided by operating activities was $27.4 million in fiscal
2014, as compared to $59.4 million in the prior year. The $32.0 million decrease was due to a decrease
in net earnings, net of non-cash adjustments of $35.7 million, offset by an increase in operating assets
and liabilities of $4.1 million. The change in operating assets and liabilities was primarily due to a
favorable change in inventory, net of accounts payable, of $10.2 million and a favorable change in other
long-term liabilities of $1.0 million, offset by an unfavorable change in accrued expenses and other
current assets of $7.1 million. The change in accrued expenses and other current assets was primarily
due to the resolution of our accrued medical claims as we converted from a self-insured to a fully-
insured program.
Taking into consideration changes in our trade payable program liability (shown as cash flows from
financing activities on the consolidated statements of cash flows), cash used in accounts payable was
$16.9 million in fiscal 2014 as compared to $11.5 million for fiscal 2013. The ratio of accounts payable,
including our trade payable program, to inventory was 56.0% at January 31, 2015 and 57.4% at
February 1, 2014. The $15.4 million decrease in inventory from February 1, 2014 was primarily due to
lower purchases in fiscal 2014.
Cash used in investing activities was $47.0 million in fiscal 2014 as compared to $65.3 million in
the prior year period. Capital expenditures were $67.3 million and $54.0 million in 2014 and 2013,
respectively. Capital expenditures for 2014, in addition to our regularly scheduled store and distribution
26