Pep Boys 2014 Annual Report Download - page 28
Download and view the complete annual report
Please find page 28 of the 2014 Pep Boys annual report below. You can navigate through the pages in the report by either clicking on the pages listed below, or by using the keyword search tool below to find specific information within the annual report.-
 1
1 -
2
-
3
-
4
-
5
-
6
-
7
-
8
-
9
-
10
-
11
-
12
-
13
-
14
-
15
-
16
-
17
-
 18
18 -
 19
19 -
 20
20 -
 21
21 -
 22
22 -
 23
23 -
 24
24 -
 25
25 -
 26
26 -
 27
27 -
 28
28 -
 29
29 -
 30
30 -
 31
31 -
 32
32 -
 33
33 -
 34
34 -
 35
35 -
 36
36 -
 37
37 -
 38
38 -
39
-
40
-
41
-
42
-
43
-
44
-
45
-
46
-
47
-
48
-
49
-
50
-
51
-
52
-
53
-
54
-
55
-
56
-
57
-
58
-
59
-
60
-
61
-
62
-
63
-
64
-
65
-
66
-
67
-
68
-
69
-
70
-
71
-
72
-
73
-
74
-
75
-
76
-
77
-
78
-
79
-
80
-
81
-
82
-
83
-
84
-
85
-
86
-
87
-
88
-
89
-
90
-
91
-
92
 |
 |
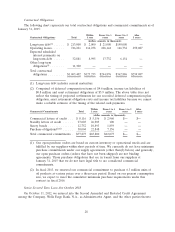
Fiscal 2014 vs. Fiscal 2013
Total revenue for fiscal 2014 increased by $18.0 million, or 0.9%, to $2,084.6 million from
$2,066.6 million for fiscal 2013 driven by our non-comparable store locations, while comparable sales
remained relatively flat. Comparable store sales were comprised of a 4.9% comparable service revenue
increase offset by a 1.6% comparable merchandise sales decline. While our total revenues are favorably
impacted by the opening of new stores, a new store is not added to our comparable store sales until it
reaches its 13th month of operation.
Our total online sales are currently an immaterial portion of our total sales and comparable store
sales. Customer online purchases that are picked up at our stores or delivered to customers’ homes are
included in our comparable store sales calculation.
Total merchandise sales decreased 0.9%, or $14.8 million, to $1,593.9 million for fiscal 2014,
compared to $1,608.7 million for fiscal 2013. Comparable merchandise sales decreased by 1.6%, or
$25.3 million. Our non-comparable stores contributed an additional $10.4 million of merchandise
revenue in fiscal 2014.
Total service revenue increased 7.2%, or $32.8 million, to $490.7 million for fiscal 2014 from
$457.9 million for fiscal 2013. Comparable service revenue increased by 4.9%, or $22.3 million. Our
non-comparable store locations contributed an additional $10.5 million of service revenues in fiscal
2014. The increase in comparable store service revenue was primarily due to an increase in the average
transaction amount per customer.
In our retail business, continued competitive pressures led to a comparable store customer counts
decline of 5.1%, while higher selling price resulted in a 3.3% increase in average revenue per
transaction.
In our service business, we believe the decline in comparable store transaction counts of 2.0% was
due primarily to a cooler than normal summer that reduced demand for batteries, air conditioning
work and engine performance and diagnostic services. In addition, oil change transactions declined due
to less promotional activity as compared to the prior year. Service average revenue per transaction
increased by 3.4%, primarily due to higher selling prices and a shift in sales mix to higher priced tires.
Total gross profit decreased by $11.9 million, or 2.4%, to $475.4 million for fiscal 2014 from
$487.4 million for fiscal 2013. Total gross profit margin decreased to 22.8% for fiscal 2014 from 23.6%
for fiscal 2013. Total gross profit for fiscal 2014 and 2013 included an asset impairment charge of
$7.5 million and $7.7 million, respectively. Excluding this item from both years, total gross profit margin
decreased to 23.2% for fiscal 2014 from 24.0% for fiscal 2013. The decrease was primarily due to lower
vendor support funds, higher occupancy costs (utilities and rent) and higher warehousing costs.
Gross profit from merchandise sales decreased by $31.2 million, or 6.2%, to $469.1 million for
fiscal 2014 from $500.3 million for fiscal 2013. Gross profit margin from merchandise sales decreased to
29.4% for fiscal 2014 from 31.1% in fiscal 2013. Gross profit from merchandise sales in fiscal 2014 and
2013 included an asset impairment charge of $2.5 million and $2.3 million, respectively. Excluding this
item from both years, gross profit margin from merchandise sales decreased to 29.6% for fiscal 2014
from 31.3% in fiscal 2013. The decrease in gross profit margin was primarily due to lower product
margins resulting from a change in sales mix, lower vendor support funds, higher inventory
obsolescence and shrinkage reserves and higher occupancy costs (utilities and rent)
Gross margin profit from service revenue for fiscal 2014 improved by $19.3 million to a profit of
$6.3 million from a loss of $13.0 million for fiscal 2013. In accordance with GAAP, service revenue is
limited to labor sales (excludes any revenue from installed parts and materials) and costs of service
revenues includes the fully loaded service center payroll and related employee benefits and service
center occupancy costs (rents, utilities and building maintenance). Excluding impairment charges of
22