Pep Boys 2014 Annual Report Download - page 63
Download and view the complete annual report
Please find page 63 of the 2014 Pep Boys annual report below. You can navigate through the pages in the report by either clicking on the pages listed below, or by using the keyword search tool below to find specific information within the annual report.-
 1
1 -
2
-
3
-
4
-
5
-
6
-
7
-
8
-
9
-
10
-
11
-
12
-
13
-
14
-
15
-
16
-
17
-
18
-
19
-
20
-
21
-
22
-
23
-
24
-
25
-
26
-
27
-
28
-
29
-
30
-
31
-
32
-
33
-
34
-
35
-
36
-
37
-
38
-
39
-
40
-
41
-
42
-
43
-
44
-
45
-
46
-
47
-
48
-
49
-
50
-
51
-
52
-
 53
53 -
 54
54 -
 55
55 -
 56
56 -
 57
57 -
 58
58 -
 59
59 -
 60
60 -
 61
61 -
 62
62 -
 63
63 -
 64
64 -
 65
65 -
 66
66 -
 67
67 -
 68
68 -
 69
69 -
 70
70 -
 71
71 -
 72
72 -
 73
73 -
74
-
75
-
76
-
77
-
78
-
79
-
80
-
81
-
82
-
83
-
84
-
85
-
86
-
87
-
88
-
89
-
90
-
91
-
92
 |
 |

THE PEP BOYS—MANNY, MOE & JACK AND SUBSIDIARIES
NOTES TO CONSOLIDATED FINANCIAL STATEMENTS (Continued)
Years ended January 31, 2015, February 1, 2014 and February 2, 2013
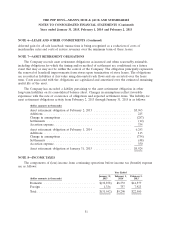
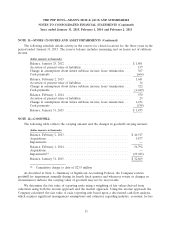
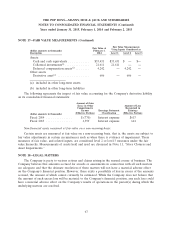
NOTE 11—STORE CLOSURES AND ASSET IMPAIRMENTS (Continued)
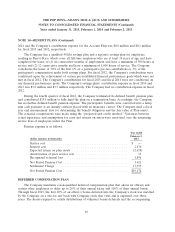
The following schedule details activity in the reserve for closed locations for the three years in the
period ended January 31, 2015. The reserve balance includes remaining rent on leases net of sublease
income.
(dollar amounts in thousands)
Balance, January 28, 2012 .................................... $1,801
Accretion of present value of liabilities ........................... 137
Change in assumptions about future sublease income, lease termination . . . 367
Cash payments ............................................ (664)
Balance, February 2, 2013 .................................... 1,641
Accretion of present value of liabilities ........................... 36
Change in assumptions about future sublease income, lease termination . . . 322
Cash payments ............................................ (1,449)
Balance, February 1, 2014 .................................... 550
Accretion of present value of liabilities ........................... 29
Change in assumptions about future sublease income, lease termination . . . 1,434
Cash payments ............................................ (538)
Balance, January 31, 2015 .................................... $1,475
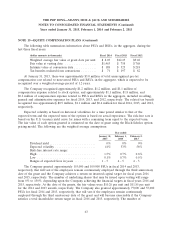
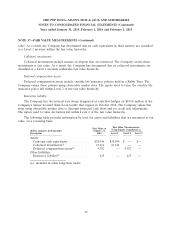
NOTE 12—GOODWILL
The following table reflects the carrying amount and the changes in goodwill carrying amount:
(dollar amounts in thousands)
Balance, February 2, 2013 .................................... $46,917
Acquisitions .............................................. 9,877
Impairments ............................................. —
Balance, February 1, 2014 .................................... 56,794
Acquisitions .............................................. —
Impairments(a) ............................................ (23,925)
Balance, January 31, 2015 .................................... $32,869
(a) Cumulative charge to date of $23.9 million
As described in Note 1—Summary of Significant Accounting Policies, the Company reviews
goodwill for impairment annually during its fourth fiscal quarter and whenever events or changes in
circumstances indicate the carrying value of goodwill may not be recoverable.
We determine the fair value of reporting units using a weighting of fair values derived from
valuations using both the income approach and the market approach. Using the income approach the
Company calculated the fair value of each reporting unit based upon a discounted cash flow analysis,
which requires significant management assumptions and estimates regarding industry, economic factors
57