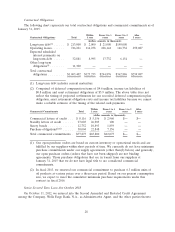
Pep Boys 2014 Annual Report Download - page 31
Download and view the complete annual report
Please find page 31 of the 2014 Pep Boys annual report below. You can navigate through the pages in the report by either clicking on the pages listed below, or by using the keyword search tool below to find specific information within the annual report.-
 1
1 -
2
-
3
-
4
-
5
-
6
-
7
-
8
-
9
-
10
-
11
-
12
-
13
-
14
-
15
-
16
-
17
-
18
-
19
-
20
-
 21
21 -
 22
22 -
 23
23 -
 24
24 -
 25
25 -
 26
26 -
 27
27 -
 28
28 -
 29
29 -
 30
30 -
 31
31 -
 32
32 -
 33
33 -
 34
34 -
 35
35 -
 36
36 -
 37
37 -
 38
38 -
 39
39 -
 40
40 -
 41
41 -
42
-
43
-
44
-
45
-
46
-
47
-
48
-
49
-
50
-
51
-
52
-
53
-
54
-
55
-
56
-
57
-
58
-
59
-
60
-
61
-
62
-
63
-
64
-
65
-
66
-
67
-
68
-
69
-
70
-
71
-
72
-
73
-
74
-
75
-
76
-
77
-
78
-
79
-
80
-
81
-
82
-
83
-
84
-
85
-
86
-
87
-
88
-
89
-
90
-
91
-
92
 |
 |
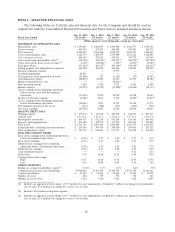
In the second quarter of fiscal 2012, we terminated our proposed ‘‘go private’’ transaction and
recorded the settlement proceeds, net of merger related costs, of $42.8 million in the consolidated
statement of operations and comprehensive income.
Interest expense for fiscal 2013 was $14.8 million, a decrease of $19.2 million, from $34.0 million
reported for fiscal 2012. Excluding refinancing costs of $0.4 million and $11.2 million in fiscal 2013 and
2012, respectively, interest declined by $8.4 million and reflects a lower interest rate on reduced total
debt outstanding. In the third quarter of fiscal 2012, we refinanced our long term debt to reduce the
amount outstanding by $95.1 million and in the fourth quarter of fiscal 2013, we further reduced the
interest rate on our Senior Secured Term Loan by 75 basis points (See Note 5 to the Consolidated
Financial Statements).
Our income tax expense for fiscal 2013 was $2.2 million, or an effective rate of 24.1%, as
compared to an expense of $9.3 million, or an effective rate of 41.5%, for fiscal 2012. The decrease in
rate from period to period was primarily driven by a reduction in pre-tax income in relation to certain
permanent tax items and tax credits. In addition, the rate was impacted by a change in foreign tax law
enacted during fiscal 2013 and a favorable adjustment to deferred tax assets in our foreign operations.
As a result of the foregoing, we had net earnings of $6.9 million for fiscal 2013 as compared to net
earnings of $12.8 million for fiscal 2012. Our diluted earnings per share were $0.13 as compared to
$0.24 in the prior year period.
Discontinued Operations
The analysis of our results of continuing operations excludes the operating results of closed stores,
where the customer base could not be maintained, which have been classified as discontinued
operations for all periods presented.
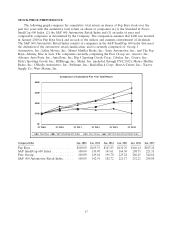
Industry Comparison
We operate in the U.S. automotive aftermarket, which has two general lines of business: (1) the
Service business, defined as Do-It-For-Me (service labor, installed merchandise and tires) and (2) the
Retail business, defined as Do-It-Yourself (retail merchandise) and commercial. Generally, specialized
automotive retailers focus on either the Service or Retail area of the business. We believe that
operation in both the Service and Retail areas differentiates us from our competitors. Although we
manage our store performance at a store level in the aggregate, we believe that the following
presentation, which includes the reclassification of revenue from merchandise that we install in
customer vehicles to service center revenue, shows an accurate comparison against competitors within
the two sales arenas. We compete in the Retail area of the business through our retail sales floor and
25