Pep Boys 2014 Annual Report Download - page 68
Download and view the complete annual report
Please find page 68 of the 2014 Pep Boys annual report below. You can navigate through the pages in the report by either clicking on the pages listed below, or by using the keyword search tool below to find specific information within the annual report.-
 1
1 -
2
-
3
-
4
-
5
-
6
-
7
-
8
-
9
-
10
-
11
-
12
-
13
-
14
-
15
-
16
-
17
-
18
-
19
-
20
-
21
-
22
-
23
-
24
-
25
-
26
-
27
-
28
-
29
-
30
-
31
-
32
-
33
-
34
-
35
-
36
-
37
-
38
-
39
-
40
-
41
-
42
-
43
-
44
-
45
-
46
-
47
-
48
-
49
-
50
-
51
-
52
-
53
-
54
-
55
-
56
-
57
-
 58
58 -
 59
59 -
 60
60 -
 61
61 -
 62
62 -
 63
63 -
 64
64 -
 65
65 -
 66
66 -
 67
67 -
 68
68 -
 69
69 -
 70
70 -
 71
71 -
 72
72 -
 73
73 -
 74
74 -
 75
75 -
 76
76 -
 77
77 -
 78
78 -
79
-
80
-
81
-
82
-
83
-
84
-
85
-
86
-
87
-
88
-
89
-
90
-
91
-
92
 |
 |

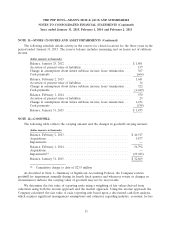
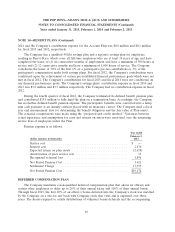
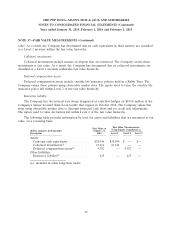
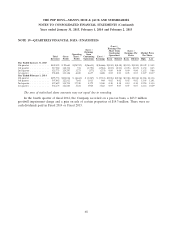
THE PEP BOYS—MANNY, MOE & JACK AND SUBSIDIARIES
NOTES TO CONSOLIDATED FINANCIAL STATEMENTS (Continued)
Years ended January 31, 2015, February 1, 2014 and February 2, 2013
NOTE 15—EQUITY COMPENSATION PLANS (Continued)
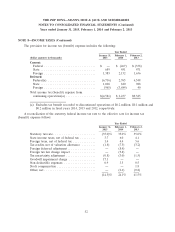
The following table summarizes the options under the Stock Incentive Plan:
Fiscal Year 2014
Weighted Average
Shares Exercise Price
Outstanding—beginning of year .................. 1,658,471 $ 8.67
Granted .................................... 1,234,447 8.02
Exercised ................................... (255,023) 3.73
Forfeited ................................... (878,801) 7.15
Expired .................................... (212,818) 13.11
Outstanding—end of year ....................... 1,546,276 9.22
Vested and expected to vest options—end of year ..... 1,499,115 9.18
Options exercisable—end of year ................. 921,422 8.28
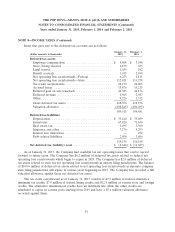
The following table summarizes information about options during the last three fiscal years (dollars
in thousands except per option):
Fiscal 2014 Fiscal 2013 Fiscal 2012
Weighted average fair value at grant date per
option .............................. $ 2.25 $ 5.11 $4.65
Intrinsic value of options exercised ........... $1,532 $1,059 $ 874
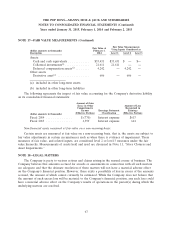
The aggregate intrinsic value of outstanding options, exercisable options and expected to vest
options at January 31, 2015 was $1.5 million, $1.5 million and $0.0 million, respectively. At January 31,
2015, the weighted average remaining contractual term of outstanding options, exercisable options and
expected to vest options was 4.2 years, 2.9 years and 6.2 years, respectively. At January 31, 2015, there
was approximately $1.7 million of total unrecognized pre-tax compensation cost related to non-vested
stock options, which is expected to be recognized over a weighted average period of 1.4 years.
The following table summarizes information about non-vested PSUs and RSUs since February 1,
2014:
Number of Number of Weighted Average
PSUs RSUs Total Fair Value
Nonvested at February 1, 2014 ................. 675,513 149,945 825,458 $10.68
Granted ................................. 367,102 337,111 704,213 8.03
Forfeited ................................ (581,609) (45,604) (627,213) 7.37
Vested .................................. —(142,942) (142,942) 10.59
Nonvested at January 31, 2015 ................. 461,006 298,510 759,516 7.93
62