Pep Boys 2014 Annual Report Download - page 45
Download and view the complete annual report
Please find page 45 of the 2014 Pep Boys annual report below. You can navigate through the pages in the report by either clicking on the pages listed below, or by using the keyword search tool below to find specific information within the annual report.-
 1
1 -
2
-
3
-
4
-
5
-
6
-
7
-
8
-
9
-
10
-
11
-
12
-
13
-
14
-
15
-
16
-
17
-
18
-
19
-
20
-
21
-
22
-
23
-
24
-
25
-
26
-
27
-
28
-
29
-
30
-
31
-
32
-
33
-
34
-
 35
35 -
 36
36 -
 37
37 -
 38
38 -
 39
39 -
 40
40 -
 41
41 -
 42
42 -
 43
43 -
 44
44 -
 45
45 -
 46
46 -
 47
47 -
 48
48 -
 49
49 -
 50
50 -
 51
51 -
 52
52 -
 53
53 -
 54
54 -
 55
55 -
56
-
57
-
58
-
59
-
60
-
61
-
62
-
63
-
64
-
65
-
66
-
67
-
68
-
69
-
70
-
71
-
72
-
73
-
74
-
75
-
76
-
77
-
78
-
79
-
80
-
81
-
82
-
83
-
84
-
85
-
86
-
87
-
88
-
89
-
90
-
91
-
92
 |
 |

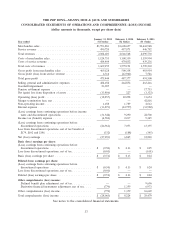
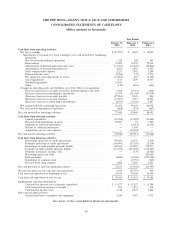
THE PEP BOYS—MANNY, MOE & JACK AND SUBSIDIARIES
CONSOLIDATED STATEMENTS OF CASH FLOWS
(dollar amounts in thousands)
Year Ended
January 31, February 1, February 2,
2015 2014 2013
Cash flows from operating activities:
Net (loss) earnings ......................................... $(27,293) $ 6,865 $ 12,810
Adjustments to reconcile net (loss) earnings to net cash provided by continuing
operations:
Net loss from discontinued operations .......................... 332 188 345
Depreciation .......................................... 75,099 78,439 79,104
Amortization of deferred gain from asset sales .................... (13,389) (12,604) (12,846)
Amortization of deferred financing costs ........................ 2,563 2,993 4,431
Stock compensation expense ................................ 2,257 2,992 1,299
Deferred income taxes ................................... (6,588) (79) 7,576
Net (gain) loss from dispositions of assets ....................... (13,806) 227 (1,323)
Asset impairment ....................................... 7,535 7,659 10,555
Goodwill impairment .................................... 23,925 ——
Other .............................................. (139) (493) (269)
Changes in operating assets and liabilities, net of the effects of acquisitions:
Decrease (increase) in accounts receivable, prepaid expenses and other .... 4,366 (6,511) (602)
Decrease (increase) in merchandise inventories .................... 15,397 (31,146) (27,074)
(Decrease) increase in accounts payable ........................ (27,963) 8,378 984
(Decrease) increase in accrued expenses ........................ (11,853) 6,115 10,481
(Decrease) increase in other long-term liabilities ................... (2,391) (3,345) 3,487
Net cash provided by continuing operations ......................... 28,052 59,678 88,958
Net cash used in discontinued operations .......................... (608) (274) (467)
Net cash provided by operating activities ............................ 27,444 59,404 88,491
Cash flows from investing activities:
Capital expenditures ..................................... (67,269) (53,982) (54,696)
Proceeds from dispositions of assets ........................... 20,227 21 5,588
Additions to collateral investment ............................ —(2,312) (3,654)
Release of collateral investment ............................. — 1,650 —
Acquisitions, net of cash acquired ............................ —(10,694) —
Net cash used in investing activities ................................ (47,042) (65,317) (52,762)
Cash flows from financing activities:
Borrowings under line of credit agreements ...................... 598,495 40,745 2,319
Payments under line of credit agreements ....................... (584,995) (37,245) (2,319)
Borrowings on trade payable program liability ..................... 182,462 154,985 179,751
Payments on trade payable program liability ...................... (171,359) (174,902) (115,247)
Payments for finance issuance costs ........................... —(770) (6,520)
Borrowings under new debt ................................ ——200,000
Debt payments ........................................ (2,000) (2,000) (295,122)
Repurchase of common stock ............................... —(2,750) (342)
Proceeds from stock issuance ............................... 1,608 2,095 2,693
Net cash provided by (used in) financing activities ...................... 24,211 (19,842) (34,787)
Net increase (decrease) in cash and cash equivalents ..................... 4,613 (25,755) 942
Cash and cash equivalents at beginning of year ........................ 33,431 59,186 58,244
Cash and cash equivalents at end of year ............................ $ 38,044 $ 33,431 $ 59,186
Supplemental cash flow information:
Cash paid for interest, net of amounts capitalized .................. $ 11,377 $ 12,027 $ 31,290
Cash received from income tax refunds ......................... 292 1,251 108
Cash paid for income taxes ................................ 1,418 4,377 2,826
Non-cash investing activities:
Accrued purchases of property and equipment .................... 3,346 3,467 1,371
See notes to the consolidated financial statements.
39