Pep Boys 2014 Annual Report Download - page 64
Download and view the complete annual report
Please find page 64 of the 2014 Pep Boys annual report below. You can navigate through the pages in the report by either clicking on the pages listed below, or by using the keyword search tool below to find specific information within the annual report.-
 1
1 -
2
-
3
-
4
-
5
-
6
-
7
-
8
-
9
-
10
-
11
-
12
-
13
-
14
-
15
-
16
-
17
-
18
-
19
-
20
-
21
-
22
-
23
-
24
-
25
-
26
-
27
-
28
-
29
-
30
-
31
-
32
-
33
-
34
-
35
-
36
-
37
-
38
-
39
-
40
-
41
-
42
-
43
-
44
-
45
-
46
-
47
-
48
-
49
-
50
-
51
-
52
-
53
-
 54
54 -
 55
55 -
 56
56 -
 57
57 -
 58
58 -
 59
59 -
 60
60 -
 61
61 -
 62
62 -
 63
63 -
 64
64 -
 65
65 -
 66
66 -
 67
67 -
 68
68 -
 69
69 -
 70
70 -
 71
71 -
 72
72 -
 73
73 -
 74
74 -
75
-
76
-
77
-
78
-
79
-
80
-
81
-
82
-
83
-
84
-
85
-
86
-
87
-
88
-
89
-
90
-
91
-
92
 |
 |
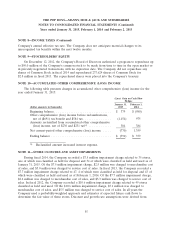
THE PEP BOYS—MANNY, MOE & JACK AND SUBSIDIARIES
NOTES TO CONSOLIDATED FINANCIAL STATEMENTS (Continued)
Years ended January 31, 2015, February 1, 2014 and February 2, 2013
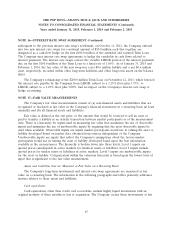
NOTE 12—GOODWILL (Continued)
and the future profitability of our businesses. The market approach developed an estimated fair value
based on market multiples of revenue and earnings derived from comparable publicly traded companies
with operating and investment characteristics that were comparable to the operating and investment
characteristics of the Reporting Unit.
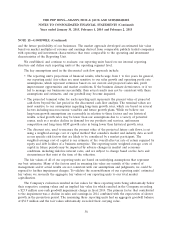
We established, and continue to evaluate, our reporting units based on our internal reporting
structure and define such reporting units at the operating segment level.
The key assumptions used in the discounted cash flow approach include:
• The reporting unit’s projections of financial results, which range from 1 to five years. In general,
our reporting units’ fair values are most sensitive to our sales growth and operating profit rate
assumptions, which represent estimates based on our current and projected sales mix, profit
improvement opportunities and market conditions. If the business climate deteriorates, or if we
fail to manage our businesses successfully, then actual results may not be consistent with these
assumptions and estimates, and our goodwill may become impaired.
• The projected terminal value for each reporting unit represents the present value of projected
cash flows beyond the last period in the discounted cash flow analysis. The terminal values are
most sensitive to our assumptions regarding long-term growth rates, which are based on several
factors including macroeconomic variables and future growth plans. While we believe our
long-term growth assumptions are reasonable in relation to these factors and our historical
results, actual growth rates may be lower than our assumptions due to a variety of potential
causes, such as a secular decline in demand for our products and services, unforeseen
competition and long-term GDP growth rates in being lower than historical growth rates.
• The discount rate, used to measure the present value of the projected future cash flows, is set
using a weighted-average cost of capital method that considers market and industry data as well
as our specific risk factors that are likely to be considered by a market participant. The
weighted-average cost of capital is our estimate of the overall after-tax rate of return required by
equity and debt holders of a business enterprise. The reporting units’ weighted-average costs of
capital in future periods may be impacted by adverse changes in market and economic
conditions, including risk-free interest rates, and are subject to change based on the facts and
circumstances that exist at the time of the valuation.
The fair values of all of our reporting units are based on underlying assumptions that represent
our best estimates. Many of the factors used in assessing fair value are outside of the control of
management and if actual results are not consistent with our assumptions and judgments, we could be
exposed to further impairment charges. To validate the reasonableness of our reporting units’ estimated
fair values, we reconcile the aggregate fair values of our reporting units to our total market
capitalization.
The Company’s evaluation resulted in fair values for three reporting units being substantially below
their respective carrying values and an implied fair value for which resulted in the Company recording
a $23.9 million non-cash goodwill impairment charge in fiscal 2014. The primary factor that contributed
to the impairment was a decline in sales and earnings in 2014 combined with the expectation of slower
growth in the projection period. The remaining three reporting units had an aggregate goodwill balance
of $32.9 million and the fair values substantially exceeded their carrying value.
58