Pep Boys 2014 Annual Report Download - page 26
Download and view the complete annual report
Please find page 26 of the 2014 Pep Boys annual report below. You can navigate through the pages in the report by either clicking on the pages listed below, or by using the keyword search tool below to find specific information within the annual report.-
 1
1 -
2
-
3
-
4
-
5
-
6
-
7
-
8
-
9
-
10
-
11
-
12
-
13
-
14
-
15
-
 16
16 -
 17
17 -
 18
18 -
 19
19 -
 20
20 -
 21
21 -
 22
22 -
 23
23 -
 24
24 -
 25
25 -
 26
26 -
 27
27 -
 28
28 -
 29
29 -
 30
30 -
 31
31 -
 32
32 -
 33
33 -
 34
34 -
 35
35 -
 36
36 -
37
-
38
-
39
-
40
-
41
-
42
-
43
-
44
-
45
-
46
-
47
-
48
-
49
-
50
-
51
-
52
-
53
-
54
-
55
-
56
-
57
-
58
-
59
-
60
-
61
-
62
-
63
-
64
-
65
-
66
-
67
-
68
-
69
-
70
-
71
-
72
-
73
-
74
-
75
-
76
-
77
-
78
-
79
-
80
-
81
-
82
-
83
-
84
-
85
-
86
-
87
-
88
-
89
-
90
-
91
-
92
 |
 |
existing Supercenters and support infrastructure. We also operate a handful of legacy DIY only Pep
Express stores.
In fiscal 2014, we opened 19 new Service & Tire Centers, two new Supercenters and converted one
Supercenter into a Service & Tire Center. We also closed eight Service & Tire Centers and six
Supercenters. As of January 31, 2015, we operated 563 Supercenters, 237 Service & Tire Centers and
six Pep Express stores located in 35 states and Puerto Rico.
EXECUTIVE SUMMARY
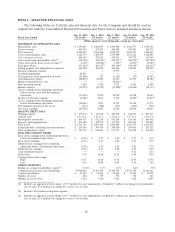
Net loss for fiscal 2014 was $27.3 million, or $0.51 per share, as compared to net earnings of
$6.9 million, or $0.13 per share, reported for fiscal 2013. Fiscal 2014 results included, on a pre-tax basis
a goodwill impairment charge of $23.9 million and a $4.0 million litigation charge, partially offset by a
gain on sale of certain properties of $13.8 million.
Total revenues increased by 0.9%, or $18.0 million, as compared to the same period in the prior
year due to increased contribution from our non-comparable store locations. Our comparable store
sales (sales generated by locations in operation during the same period of the prior year) remained
relatively flat and were comprised of a 4.9% increase in comparable store service revenue offset by a
1.6% decrease in comparable store merchandise sales.
We believe that the industry fundamentals of increasing vehicle complexity and customer
preference for DIFM remain solid over the long-term resulting in consistent demand for maintenance
and repair services. Consistent with this long-term trend, we have adopted a long-term strategy of
growing our automotive service business, while maintaining our DIY customer base by offering the
newest and broadest product assortment in the automotive aftermarket.
In the short-term, however, various factors within the economy affect both our customers and our
industry, including a weak recovery from the recent recession, continued high underemployment and
the tepid growth in real wages. We believe that these factors challenge our customers’ spending relative
to discretionary and deferrable purchases. These spending habits impact miles driven which, in turn,
impact sales of our services and non-discretionary products. Given the nature of these macroeconomic
factors, we cannot predict whether or for how long these trends may continue, nor can we predict to
what degree these trends will affect us in the future.
Over the past few years, we have invested in our business to drive top line sales with investments
in marketing & promotions, new stores (Service & Tire Centers), digital operations and, most recently,
a new market concept that we call the ‘‘Road Ahead.’’ Designed around the shopping habits of our
target customer segments, this concept enhances the entire store—our people, the product assortment,
its exterior and interior look and feel and the marketing programs—to learn how we can be successful
in attracting more of these target customers and earn a greater share of their annual spend in the
automotive aftermarket. While each initiative has produced results, they have also brought added
expense. Total sales growth has been relatively flat due in large part to the decline in our DIY business,
which combined with increased expenses has led to declining profit margins. Accordingly, we continue
to review expenses related to our base business so we can continue to invest in our initiatives. See
‘‘ITEM 1 BUSINESS—BUSINESS STRATEGY.’’
20