Panera Bread 2015 Annual Report Download - page 69
Download and view the complete annual report
Please find page 69 of the 2015 Panera Bread annual report below. You can navigate through the pages in the report by either clicking on the pages listed below, or by using the keyword search tool below to find specific information within the annual report.-
 1
1 -
2
-
3
-
4
-
5
-
6
-
7
-
8
-
9
-
10
-
11
-
12
-
13
-
14
-
15
-
16
-
17
-
18
-
19
-
20
-
21
-
22
-
23
-
24
-
25
-
26
-
27
-
28
-
29
-
30
-
31
-
32
-
33
-
34
-
35
-
36
-
37
-
38
-
39
-
40
-
41
-
42
-
43
-
44
-
45
-
46
-
47
-
48
-
49
-
50
-
51
-
52
-
53
-
54
-
55
-
56
-
57
-
58
-
 59
59 -
 60
60 -
 61
61 -
 62
62 -
 63
63 -
 64
64 -
 65
65 -
 66
66 -
 67
67 -
 68
68 -
 69
69 -
 70
70 -
 71
71 -
 72
72 -
 73
73 -
 74
74 -
 75
75 -
 76
76 -
 77
77 -
 78
78 -
 79
79 -
80
-
81
-
82
-
83
-
84
-
85
-
86
-
87
-
88
-
89
-
90
-
91
-
92
-
93
-
94
-
95
-
96
 |
 |

PANERA BREAD COMPANY
NOTES TO THE CONSOLIDATED FINANCIAL STATEMENTS (continued)
59
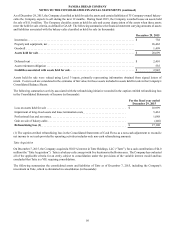
7. Property and Equipment, net
Major classes of property and equipment consisted of the following (in thousands):
December 29,
2015
December 30,
2014
Leasehold improvements . . . . . . . . . . . . . . . . . . . . . . . . . . . . . . . . . . . . . . . . . . . . . . . . . . . . . . $ 683,296 $ 693,503
Machinery and equipment . . . . . . . . . . . . . . . . . . . . . . . . . . . . . . . . . . . . . . . . . . . . . . . . . . . . . 338,500 340,854
Computer hardware and software. . . . . . . . . . . . . . . . . . . . . . . . . . . . . . . . . . . . . . . . . . . . . . . . 192,521 137,663
Furniture and fixtures . . . . . . . . . . . . . . . . . . . . . . . . . . . . . . . . . . . . . . . . . . . . . . . . . . . . . . . . . 159,653 167,383
Construction in progress . . . . . . . . . . . . . . . . . . . . . . . . . . . . . . . . . . . . . . . . . . . . . . . . . . . . . . . 97,416 99,255
Smallwares . . . . . . . . . . . . . . . . . . . . . . . . . . . . . . . . . . . . . . . . . . . . . . . . . . . . . . . . . . . . . . . . . 29,056 29,841
Land . . . . . . . . . . . . . . . . . . . . . . . . . . . . . . . . . . . . . . . . . . . . . . . . . . . . . . . . . . . . . . . . . . . . . . 1,604 2,060
1,502,046 1,470,559
Less: accumulated depreciation . . . . . . . . . . . . . . . . . . . . . . . . . . . . . . . . . . . . . . . . . . . . . . . . . (725,798)(683,265)
Property and equipment, net . . . . . . . . . . . . . . . . . . . . . . . . . . . . . . . . . . . . . . . . . . . . . . . . . . . . $ 776,248 $ 787,294
The Company recorded depreciation expense related to these assets of $126.7 million, $115.4 million, and $97.2 million during
fiscal 2015, fiscal 2014, and fiscal 2013, respectively.
8. Goodwill
The following is a reconciliation of the beginning and ending balances of the Company’s goodwill by reportable segment at
December 29, 2015 and December 30, 2014 (in thousands):
Company Bakery-
Cafe Operations
Franchise
Operations
Fresh Dough and Other
Product Operations Total
Balance as of December 31, 2013. . . . . . . . . . . $ 119,384 $ 1,934 $ 1,695 $ 123,013
Impairment charge . . . . . . . . . . . . . . . . . . . . . . (2,057)— —
(2,057)
Currency translation . . . . . . . . . . . . . . . . . . . . . (178)— —
(178)
Balance as of December 30, 2014. . . . . . . . . . . $ 117,149 $ 1,934 $ 1,695 $ 120,778
Acquisition of Tatte. . . . . . . . . . . . . . . . . . . . . . 2,512 — — 2,512
Goodwill classified as held for sale . . . . . . . . . (1,499)— —
(1,499)
Balance as of December 29, 2015. . . . . . . . . . . $ 118,162 $ 1,934 $ 1,695 $ 121,791
The Company did not record a goodwill impairment charge in either fiscal 2015 or fiscal 2013. The Company recorded a $2.1
million full impairment charge of goodwill for the Canadian bakery-cafe operations reporting unit during fiscal 2014.
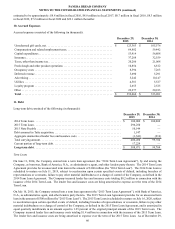
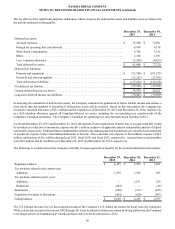
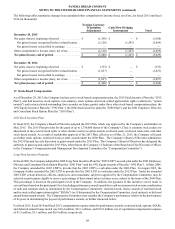
9. Other Intangible Assets
Other intangible assets consisted of the following (in thousands):
December 29, 2015 December 30, 2014
Gross
Carrying
Value
Accumulated
Amortization
Net
Carrying
Value
Gross
Carrying
Value
Accumulated
Amortization
Net
Carrying
Value
Trademark . . . . . . . . . . . . . . . . . . $ 7,080 $ (2,283) $ 4,797 $ 5,610 $ (2,017) $ 3,593
Re-acquired territory rights . . . . . 97,865 (40,432) 57,433 97,865 (32,369) 65,496
Favorable leases . . . . . . . . . . . . . . 5,012 (3,365) 1,647 4,825 (2,974) 1,851
Total other intangible assets. . . . . $ 109,957 $ (46,080) $ 63,877 $ 108,300 $ (37,360) $ 70,940
Amortization expense on these intangible assets for fiscal 2015, fiscal 2014, and fiscal 2013, was approximately $8.7 million,
$8.7 million, and $9.3 million, respectively. Future amortization expense on these intangible assets as of December 29, 2015 is