Panera Bread 2015 Annual Report Download - page 35
Download and view the complete annual report
Please find page 35 of the 2015 Panera Bread annual report below. You can navigate through the pages in the report by either clicking on the pages listed below, or by using the keyword search tool below to find specific information within the annual report.-
 1
1 -
2
-
3
-
4
-
5
-
6
-
7
-
8
-
9
-
10
-
11
-
12
-
13
-
14
-
15
-
16
-
17
-
18
-
19
-
20
-
21
-
22
-
23
-
24
-
 25
25 -
 26
26 -
 27
27 -
 28
28 -
 29
29 -
 30
30 -
 31
31 -
 32
32 -
 33
33 -
 34
34 -
 35
35 -
 36
36 -
 37
37 -
 38
38 -
 39
39 -
 40
40 -
 41
41 -
 42
42 -
 43
43 -
 44
44 -
 45
45 -
46
-
47
-
48
-
49
-
50
-
51
-
52
-
53
-
54
-
55
-
56
-
57
-
58
-
59
-
60
-
61
-
62
-
63
-
64
-
65
-
66
-
67
-
68
-
69
-
70
-
71
-
72
-
73
-
74
-
75
-
76
-
77
-
78
-
79
-
80
-
81
-
82
-
83
-
84
-
85
-
86
-
87
-
88
-
89
-
90
-
91
-
92
-
93
-
94
-
95
-
96
 |
 |

25
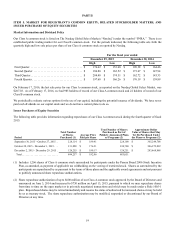
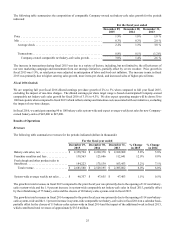
The following table summarizes the composition of comparable Company-owned net bakery-cafe sales growth for the periods
indicated:
For the fiscal year ended
December 29,
2015
December 30,
2014
December 31,
2013
Price . . . . . . . . . . . . . . . . . . . . . . . . . . . . . . . . . . . . . . . . . . . . . . . . . . . . . . . . 1.9% 1.0% 1.8 %
Mix . . . . . . . . . . . . . . . . . . . . . . . . . . . . . . . . . . . . . . . . . . . . . . . . . . . . . . . . . 0.3% 0.3% 2.0 %
Average check . . . . . . . . . . . . . . . . . . . . . . . . . . . . . . . . . . . . . . . . . . . . . . 2.2% 1.3% 3.8 %
Transactions . . . . . . . . . . . . . . . . . . . . . . . . . . . . . . . . . . . . . . . . . . . . . . . . 0.8% 0.1% (1.2)%
Company-owned comparable net bakery-cafe sales growth . . . . . . . . . 3.0% 1.4% 2.6 %
The increase in transactions during fiscal 2015 was due to a variety of factors, including, but not limited to, the effectiveness of
our new marketing campaign and momentum from our strategic initiatives, partially offset by severe weather. Price growth in
fiscal 2015 was 1.9%, as retail prices were adjusted in anticipation of labor and food cost inflation. The increase in mix in fiscal
2015 was primarily due to higher catering sales growth, more items per check, and increased sales of higher-priced items.
Fiscal 2016 Outlook
We are targeting full year fiscal 2016 diluted earnings per share growth of 2% to 5% when compared to full year fiscal 2015,
excluding the impact of one-time charges. The diluted earnings per share target range is based on anticipated Company-owned
comparable net bakery-cafe sales growth for fiscal 2016 of 3.5% to 4.5%. We also expect operating margin will be down 50 to
100 basis points when compared to fiscal 2015 which reflects startup and transition costs associated with our initiatives, excluding
the impact of one-time charges.
In fiscal 2016, we anticipate opening 90 to 100 bakery-cafes system-wide and expect average weekly net sales for new Company-
owned bakery-cafes of $45,000 to $47,000.
Results of Operations
Revenues
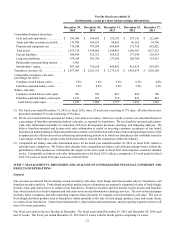
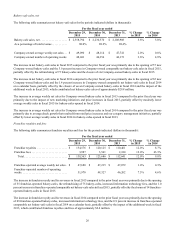
The following table summarizes revenues for the periods indicated (dollars in thousands):
For the fiscal year ended
December 29,
2015
December 30,
2014
December 31,
2013
% Change
in 2015
% Change
in 2014
Bakery-cafe sales, net . . . . . . . . . . . . . . . . . . . $ 2,358,794 $ 2,230,370 $ 2,108,908 5.8% 5.8%
Franchise royalties and fees . . . . . . . . . . . . . . 138,563 123,686 112,641 12.0% 9.8%
Fresh dough and other product sales to
franchisees. . . . . . . . . . . . . . . . . . . . . . . . . . . . 184,223 175,139 163,453 5.2% 7.1%
Total revenue . . . . . . . . . . . . . . . . . . . . . . . $ 2,681,580 $ 2,529,195 $ 2,385,002 6.0% 6.0%
System-wide average weekly net sales . . . . . . $ 48,357 $ 47,655 $ 47,403 1.5% 0.5%
The growth in total revenues in fiscal 2015 compared to the prior fiscal year was primarily due to the opening of 112 new bakery-
cafes system-wide and the 1.9 percent increase in system-wide comparable net bakery-cafe sales in fiscal 2015, partially offset
by the refranchising of 75 bakery-cafes and the closure of 20 bakery-cafes system-wide in fiscal 2015.
The growth in total revenues in fiscal 2014 compared to the prior fiscal year was primarily due to the opening of 114 new bakery-
cafes system-wide and the 1.1 percent increase in system-wide comparable net bakery-cafe sales in fiscal 2014 on a calendar basis,
partially offset by the closure of 11 bakery-cafes system-wide in fiscal 2014 and the impact of the additional week in fiscal 2013,
which contributed total revenues of approximately $35.0 million.