Panera Bread 2015 Annual Report Download - page 37
Download and view the complete annual report
Please find page 37 of the 2015 Panera Bread annual report below. You can navigate through the pages in the report by either clicking on the pages listed below, or by using the keyword search tool below to find specific information within the annual report.-
 1
1 -
2
-
3
-
4
-
5
-
6
-
7
-
8
-
9
-
10
-
11
-
12
-
13
-
14
-
15
-
16
-
17
-
18
-
19
-
20
-
21
-
22
-
23
-
24
-
25
-
26
-
 27
27 -
 28
28 -
 29
29 -
 30
30 -
 31
31 -
 32
32 -
 33
33 -
 34
34 -
 35
35 -
 36
36 -
 37
37 -
 38
38 -
 39
39 -
 40
40 -
 41
41 -
 42
42 -
 43
43 -
 44
44 -
 45
45 -
 46
46 -
 47
47 -
48
-
49
-
50
-
51
-
52
-
53
-
54
-
55
-
56
-
57
-
58
-
59
-
60
-
61
-
62
-
63
-
64
-
65
-
66
-
67
-
68
-
69
-
70
-
71
-
72
-
73
-
74
-
75
-
76
-
77
-
78
-
79
-
80
-
81
-
82
-
83
-
84
-
85
-
86
-
87
-
88
-
89
-
90
-
91
-
92
-
93
-
94
-
95
-
96
 |
 |

27
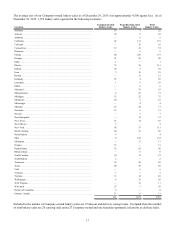
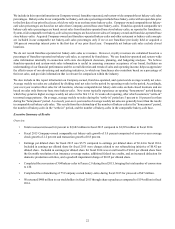
As of December 29, 2015, there were 1,071 franchise-operated bakery-cafes open and we have received commitments to open
128 additional franchise-operated bakery-cafes. The timetables for opening these bakery-cafes are established in their respective
Area Development Agreements, or ADAs, with franchisees, which provide for the majority of these bakery-cafes to open within
the next five years. An ADA requires a franchisee to develop a specified number of bakery-cafes by specified dates. If a franchisee
fails to develop bakery-cafes on the schedule set forth in the ADA, we have the right to terminate the ADA and develop Company-
owned locations or develop locations through new franchisees in that market. We may exercise one or more alternative remedies
to address defaults by franchisees, including not only development defaults, but also defaults in complying with our operating and
brand standards and other covenants included in the ADAs and franchise agreements. We may waive compliance with certain
requirements under its ADAs and franchise agreements if we determine that such action is warranted under the particular
circumstances.
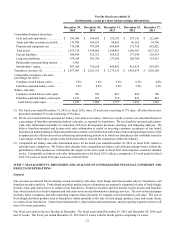
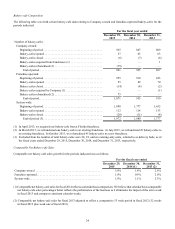
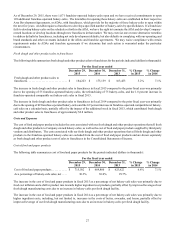
Fresh dough and other product sales to franchisees
The following table summarizes fresh dough and other product sales to franchisees for the periods indicated (dollars in thousands):
For the fiscal year ended
December 29,
2015
December 30,
2014
December 31,
2013
% Change
in 2015
% Change
in 2014
Fresh dough and other product sales to
franchisees. . . . . . . . . . . . . . . . . . . . . . . . . . . . $ 184,223 $ 175,139 $ 163,453 5.2% 7.1%
The increase in fresh dough and other product sales to franchisees in fiscal 2015 compared to the prior fiscal year was primarily
due to the opening of 55 franchise-operated bakery-cafes, the refranchising of 75 bakery-cafes, and the 1.0 percent increase in
franchise-operated comparable net bakery-cafe sales in fiscal 2015.
The increase in fresh dough and other product sales to franchisees in fiscal 2014 compared to the prior fiscal year was primarily
due to the opening of 49 franchise-operated bakery-cafes and the 0.9 percent increase in franchise-operated comparable net bakery-
cafe sales on a calendar basis, partially offset by the impact of the additional week in fiscal 2013, which contributed fresh dough
and other product sales to franchisees of approximately $2.8 million.
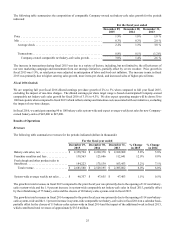
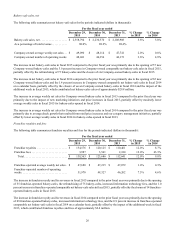
Costs and Expenses
The cost of food and paper products includes the costs associated with our fresh dough and other product operations that sell fresh
dough and other products to Company-owned bakery-cafes, as well as the cost of food and paper products supplied by third-party
vendors and distributors. The costs associated with our fresh dough and other product operations that sell fresh dough and other
products to the franchise-operated bakery-cafes are excluded from the cost of food and paper products and are shown separately
as fresh dough and other product cost of sales to franchisees in the Consolidated Statements of Income.
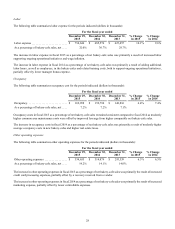
Cost of food and paper products
The following table summarizes cost of food and paper products for the periods indicated (dollars in thousands):
For the fiscal year ended
December 29,
2015
December 30,
2014
December 31,
2013
% Change
in 2015
% Change
in 2014
Cost of food and paper products . . . . . . . . . . . $ 715,502 $ 669,860 $ 625,622 6.8% 7.1%
As a percentage of bakery-cafe sales, net . . . . 30.3% 30.0% 29.7%
The increase in the cost of food and paper products in fiscal 2015 as a percentage of net bakery-cafe sales was primarily due to
food cost inflation and a shift in product mix towards higher ingredient cost products, partially offset by improved leverage of our
fresh dough manufacturing costs due to an increase in bakery-cafes per fresh dough facility.
The increase in the cost of food and paper products in fiscal 2014 as a percentage of net bakery-cafe sales was primarily due to
higher ingredient costs, including, but not limited to, increases in the costs of butter, avocados, and bacon, partially offset by
improved leverage of our fresh dough manufacturing costs due to an increase in bakery-cafes per fresh dough facility.