Panera Bread 2015 Annual Report Download - page 42
Download and view the complete annual report
Please find page 42 of the 2015 Panera Bread annual report below. You can navigate through the pages in the report by either clicking on the pages listed below, or by using the keyword search tool below to find specific information within the annual report.-
 1
1 -
2
-
3
-
4
-
5
-
6
-
7
-
8
-
9
-
10
-
11
-
12
-
13
-
14
-
15
-
16
-
17
-
18
-
19
-
20
-
21
-
22
-
23
-
24
-
25
-
26
-
27
-
28
-
29
-
30
-
31
-
 32
32 -
 33
33 -
 34
34 -
 35
35 -
 36
36 -
 37
37 -
 38
38 -
 39
39 -
 40
40 -
 41
41 -
 42
42 -
 43
43 -
 44
44 -
 45
45 -
 46
46 -
 47
47 -
 48
48 -
 49
49 -
 50
50 -
 51
51 -
 52
52 -
53
-
54
-
55
-
56
-
57
-
58
-
59
-
60
-
61
-
62
-
63
-
64
-
65
-
66
-
67
-
68
-
69
-
70
-
71
-
72
-
73
-
74
-
75
-
76
-
77
-
78
-
79
-
80
-
81
-
82
-
83
-
84
-
85
-
86
-
87
-
88
-
89
-
90
-
91
-
92
-
93
-
94
-
95
-
96
 |
 |

32
Investing Activities
Cash used in investing activities was $165.4 million, $211.3 million, and $188.3 million in fiscal 2015, fiscal 2014, and fiscal
2013, respectively. Investing activities consists primarily of capital expenditures, proceeds from the refranchising of Company-
owned bakery-cafes, the sale and leaseback of bakery-cafes, and the sale of property and equipment.
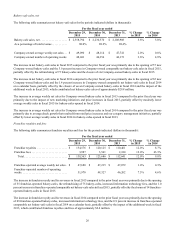
Capital Expenditures
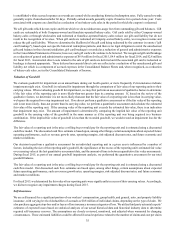
Capital expenditures are the largest ongoing component of our investing activities. New and existing bakery-cafe expenditures
include costs related to the opening of bakery-cafes and delivery hubs, to remodel and maintain bakery-cafes, and to upgrade
systems and equipment in bakery-cafes. Fresh dough facility expenditures include costs related to the opening of new fresh dough
facilities and costs to expand, remodel and maintain existing facilities. Support center expenditures primarily include investments
in technology infrastructure to create the capabilities needed to support ongoing operational initiatives and costs related to enterprise
systems and other capital needs. Capital expenditures, for the periods indicated, were as follows (in thousands):
For the fiscal year ended
December 29,
2015
December 30,
2014
December 31,
2013
New bakery-cafes. . . . . . . . . . . . . . . . . . . . . . . . . . . . . . . . . . . . . . . $ 115,552 $ 109,941 $ 90,409
Existing bakery-cafes . . . . . . . . . . . . . . . . . . . . . . . . . . . . . . . . . . . . 59,081 57,915 63,175
Fresh dough facilities . . . . . . . . . . . . . . . . . . . . . . . . . . . . . . . . . . . . 12,175 12,178 11,461
Support centers and IT infrastructure. . . . . . . . . . . . . . . . . . . . . . . . 37,124 44,183 26,965
Total . . . . . . . . . . . . . . . . . . . . . . . . . . . . . . . . . . . . . . . . . . . . . . . . $ 223,932 $ 224,217 $ 192,010
Our capital requirements have been and will continue to be significant. Our future capital requirements and the adequacy of
available funds will depend on many factors, including the pace of expansion, real estate markets, site locations, the nature of the
arrangements negotiated with landlords, and the extent of operational initiatives. We believe that cash provided by our operations,
our term loan borrowings, and available borrowings under our credit facility will be sufficient to fund our capital requirements in
both our short-term and long-term future. We currently anticipate capital expenditures of $200 million to $225 million in fiscal
2016.
Sale-Leaseback Transactions
During fiscal 2015, fiscal 2014, and fiscal 2013, we completed sale-leaseback transactions for four, six, and three Company-owned
bakery-cafes, respectively, resulting in cash proceeds of $10.1 million, $12.9 million, and $6.1 million, respectively.
Financing Activities
Cash used in financing activities was $107.2 million, $52.5 million, and $332.0 million in fiscal 2015, fiscal 2014, and fiscal 2013,
respectively. Financing activities in fiscal 2015 consisted primarily of $405.5 million used to repurchase shares of our Class A
common stock, partially offset by $299.1 million of proceeds from term loan borrowings. Financing activities in fiscal 2014
consisted primarily of $159.5 million used to repurchase shares of our Class A common stock, partially offset by $100.0 million
of proceeds from term loan borrowings. Financing activities in fiscal 2013 consisted primarily of $339.4 million used to repurchase
shares of our Class A common stock and $4.1 million for the payment of deferred acquisition holdbacks, partially offset by $8.1
million related to the benefit from stock-based compensation.
Share Repurchases
On August 23, 2012, our Board of Directors approved a three year share repurchase authorization of up to $600 million of our
Class A common stock, which we refer to as the 2012 repurchase authorization, pursuant to which we repurchased shares on the
open market under a Rule 10b5-1 plan. During fiscal 2014, we repurchased 514,357 shares under the 2012 repurchase authorization,
at an average price of $170.15 per share, for an aggregate purchase price of $87.5 million. During fiscal 2013 we purchased
1,992,250 shares under the 2012 repurchase authorization, at an average price of $166.73 per share, for an aggregate purchase
price of $332.1 million. On June 5, 2014, our Board of Directors terminated this repurchase authorization.
On June 5, 2014, our Board of Directors approved a new three year share repurchase authorization of up to $600 million of our
Class A common stock, which we refer to as the 2014 repurchase authorization, pursuant to which we may repurchase shares from
time to time on the open market or in privately negotiated transactions and which may be made under a Rule 10b5-1 plan.
Repurchased shares may be retired immediately and resume the status of authorized but unissued shares or may be held by us as