Panera Bread 2015 Annual Report Download - page 36
Download and view the complete annual report
Please find page 36 of the 2015 Panera Bread annual report below. You can navigate through the pages in the report by either clicking on the pages listed below, or by using the keyword search tool below to find specific information within the annual report.-
 1
1 -
2
-
3
-
4
-
5
-
6
-
7
-
8
-
9
-
10
-
11
-
12
-
13
-
14
-
15
-
16
-
17
-
18
-
19
-
20
-
21
-
22
-
23
-
24
-
25
-
 26
26 -
 27
27 -
 28
28 -
 29
29 -
 30
30 -
 31
31 -
 32
32 -
 33
33 -
 34
34 -
 35
35 -
 36
36 -
 37
37 -
 38
38 -
 39
39 -
 40
40 -
 41
41 -
 42
42 -
 43
43 -
 44
44 -
 45
45 -
 46
46 -
47
-
48
-
49
-
50
-
51
-
52
-
53
-
54
-
55
-
56
-
57
-
58
-
59
-
60
-
61
-
62
-
63
-
64
-
65
-
66
-
67
-
68
-
69
-
70
-
71
-
72
-
73
-
74
-
75
-
76
-
77
-
78
-
79
-
80
-
81
-
82
-
83
-
84
-
85
-
86
-
87
-
88
-
89
-
90
-
91
-
92
-
93
-
94
-
95
-
96
 |
 |

26
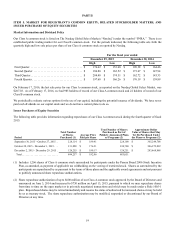
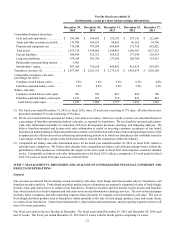
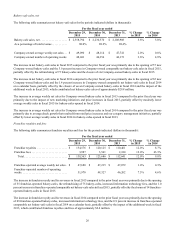
Bakery-cafe sales, net
The following table summarizes net bakery-cafe sales for the periods indicated (dollars in thousands):
For the fiscal year ended
December 29,
2015
December 30,
2014
December 31,
2013
% Change
in 2015
% Change
in 2014
Bakery-cafe sales, net . . . . . . . . . . . . . . . . . . . $ 2,358,794 $ 2,230,370 $ 2,108,908 5.8% 5.8%
As a percentage of total revenue . . . . . . . . . . . 88.0% 88.2% 88.4%
Company-owned average weekly net sales. . . $ 49,090 $ 48,114 $ 47,741 2.0% 0.8%
Company-owned number of operating weeks 48,041 46,356 44,173 3.6% 4.9%
The increase in net bakery-cafe sales in fiscal 2015 compared to the prior fiscal year was primarily due to the opening of 57 new
Company-owned bakery-cafes and the 3.0 percent increase in Company-owned comparable net bakery-cafe sales in fiscal 2015,
partially offset by the refranchising of 75 bakery-cafes and the closure of six Company-owned bakery-cafes in fiscal 2015.
The increase in net bakery-cafe sales in fiscal 2014 compared to the prior fiscal year was primarily due to the opening of 65 new
Company-owned bakery-cafes and the 1.4 percent increase in Company-owned comparable net bakery-cafe sales in fiscal 2014
on a calendar basis, partially offset by the closure of seven Company-owned bakery-cafes in fiscal 2014 and the impact of the
additional week in fiscal 2013, which contributed net bakery-cafes sales of approximately $29.8 million.
The increase in average weekly net sales for Company-owned bakery-cafes in fiscal 2015 compared to the prior fiscal year was
primarily due to the impact of new marketing initiatives and price increases in fiscal 2015, partially offset by modestly lower
average weekly sales in fiscal 2015 for bakery-cafes opened in fiscal 2014.
The increase in average weekly net sales for Company-owned bakery-cafes in fiscal 2014 compared to the prior fiscal year was
primarily due to average check growth that resulted from retail price increases and our category management initiatives, partially
offset by lower average weekly sales in fiscal 2014 for bakery-cafes opened in fiscal 2013.
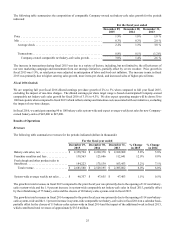
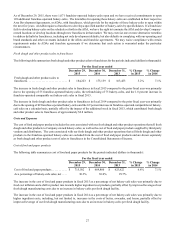
Franchise royalties and fees
The following table summarizes franchise royalties and fees for the periods indicated (dollars in thousands):
For the fiscal year ended
December 29,
2015
December 30,
2014
December 31,
2013
% Change
in 2015
% Change
in 2014
Franchise royalties . . . . . . . . . . . . . . . . . . . . . $ 134,576 $ 120,125 $ 110,461 12.0% 8.7%
Franchise fees . . . . . . . . . . . . . . . . . . . . . . . . . 3,987 3,561 2,180 12.0% 63.3%
Total . . . . . . . . . . . . . . . . . . . . . . . . . . . . . . $ 138,563 $ 123,686 $ 112,641 12.0% 9.8%
Franchise-operated average weekly net sales .$ 47,680 $ 47,215 $ 47,079 1.0% 0.3%
Franchise-operated number of operating
weeks. . . . . . . . . . . . . . . . . . . . . . . . . . . . . . . . 51,970 48,327 46,202 7.5% 4.6%
The increase in franchise royalty and fee revenues in fiscal 2015 compared to the prior fiscal year was primarily due to the opening
of 55 franchise-operated bakery-cafes, the refranchising of 75 bakery-cafes, increased information technology fees, and the 1.0
percent increase in franchise-operated comparable net bakery-cafe sales in fiscal 2015, partially offset by the closure of 14 franchise-
operated bakery-cafes in fiscal 2015.
The increase in franchise royalty and fee revenues in fiscal 2014 compared to the prior fiscal year was primarily due to the opening
of 49 franchise-operated bakery-cafes, increased information technology fees, and the 0.9 percent increase in franchise-operated
comparable net bakery-cafe sales in fiscal 2014 on a calendar basis, partially offset by the impact of the additional week in fiscal
2013, which contributed franchise royalties and fees of approximately $2.4 million.