Panera Bread 2015 Annual Report Download - page 39
Download and view the complete annual report
Please find page 39 of the 2015 Panera Bread annual report below. You can navigate through the pages in the report by either clicking on the pages listed below, or by using the keyword search tool below to find specific information within the annual report.-
 1
1 -
2
-
3
-
4
-
5
-
6
-
7
-
8
-
9
-
10
-
11
-
12
-
13
-
14
-
15
-
16
-
17
-
18
-
19
-
20
-
21
-
22
-
23
-
24
-
25
-
26
-
27
-
28
-
 29
29 -
 30
30 -
 31
31 -
 32
32 -
 33
33 -
 34
34 -
 35
35 -
 36
36 -
 37
37 -
 38
38 -
 39
39 -
 40
40 -
 41
41 -
 42
42 -
 43
43 -
 44
44 -
 45
45 -
 46
46 -
 47
47 -
 48
48 -
 49
49 -
50
-
51
-
52
-
53
-
54
-
55
-
56
-
57
-
58
-
59
-
60
-
61
-
62
-
63
-
64
-
65
-
66
-
67
-
68
-
69
-
70
-
71
-
72
-
73
-
74
-
75
-
76
-
77
-
78
-
79
-
80
-
81
-
82
-
83
-
84
-
85
-
86
-
87
-
88
-
89
-
90
-
91
-
92
-
93
-
94
-
95
-
96
 |
 |

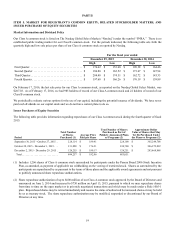
29
Fresh dough and other product cost of sales to franchisees
The following table summarizes fresh dough and other product cost of sales to franchisees for the periods indicated (dollars in
thousands):
For the fiscal year ended
December 29,
2015
December 30,
2014
December 31,
2013
% Change
in 2015
% Change
in 2014
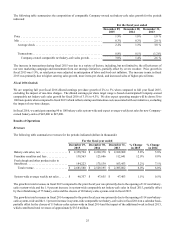
Fresh dough and other product cost of sales
to franchisees. . . . . . . . . . . . . . . . . . . . . . . . . . $ 160,706 $ 152,267 $ 142,160 5.5% 7.1%
As a percentage of fresh dough and other
product sales to franchisees. . . . . . . . . . . . . . . 87.2% 86.9% 87.0%
The increase in fresh dough and other product cost of sales to franchisees in fiscal 2015 as a percentage of fresh dough and other
product sales to franchisees was primarily the result of higher year-over-year sales of zero margin fresh produce to franchisees,
partially offset by modestly lower wheat and fuel costs.
The decrease in fresh dough and other product cost of sales to franchisees in fiscal 2014 as a percentage of fresh dough and other
product sales to franchisees was primarily the result of modestly lower wheat costs, partially offset by higher year-over-year sales
of zero margin fresh produce to franchisees.
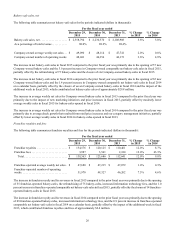
Depreciation and amortization
The following table summarizes depreciation and amortization for the periods indicated (dollars in thousands):
For the fiscal year ended
December 29,
2015
December 30,
2014
December 31,
2013
% Change
in 2015
% Change
in 2014
Depreciation and amortization . . . . . . . . . . . . $ 135,398 $ 124,109 $ 106,523 9.1% 16.5%
As a percentage of total revenues . . . . . . . . . . 5.0% 4.9% 4.5%
The increase in depreciation and amortization as a percentage of total revenues in fiscal 2015 was primarily the result of increased
depreciation on investments in bakery-cafes and support centers to support ongoing operational initiatives, partially offset by the
cessation of depreciation on assets classified as held for sale.
The increase in depreciation and amortization as a percentage of total revenues in fiscal 2014 was primarily the result of increased
depreciation on investments in bakery-cafes and support centers to support ongoing operational initiatives.
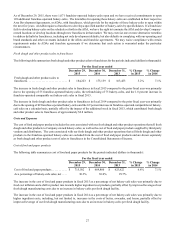
General and administrative expenses
The following table summarizes general and administrative expenses for the periods indicated (dollars in thousands):
For the fiscal year ended
December 29,
2015
December 30,
2014
December 31,
2013
% Change
in 2015
% Change
in 2014
General and administrative expenses . . . . . . . $ 142,904 $ 138,060 $ 123,335 3.5% 11.9%
As a percentage of total revenues . . . . . . . . . . 5.3% 5.5% 5.2%
The decrease in general and administrative expenses in fiscal 2015 as a percentage of total revenues was primarily a result of
lower corporate overhead expenses reflecting our previously announced initiative to reduce core general and administrative
expenses in fiscal 2015.
The increase in general and administrative expenses in fiscal 2014 as a percentage of total revenues was primarily due to an
increase in headcount to support ongoing operational initiatives, partially offset by lower incentive compensation.