Panera Bread 2015 Annual Report Download - page 68
Download and view the complete annual report
Please find page 68 of the 2015 Panera Bread annual report below. You can navigate through the pages in the report by either clicking on the pages listed below, or by using the keyword search tool below to find specific information within the annual report.-
 1
1 -
2
-
3
-
4
-
5
-
6
-
7
-
8
-
9
-
10
-
11
-
12
-
13
-
14
-
15
-
16
-
17
-
18
-
19
-
20
-
21
-
22
-
23
-
24
-
25
-
26
-
27
-
28
-
29
-
30
-
31
-
32
-
33
-
34
-
35
-
36
-
37
-
38
-
39
-
40
-
41
-
42
-
43
-
44
-
45
-
46
-
47
-
48
-
49
-
50
-
51
-
52
-
53
-
54
-
55
-
56
-
57
-
 58
58 -
 59
59 -
 60
60 -
 61
61 -
 62
62 -
 63
63 -
 64
64 -
 65
65 -
 66
66 -
 67
67 -
 68
68 -
 69
69 -
 70
70 -
 71
71 -
 72
72 -
 73
73 -
 74
74 -
 75
75 -
 76
76 -
 77
77 -
 78
78 -
79
-
80
-
81
-
82
-
83
-
84
-
85
-
86
-
87
-
88
-
89
-
90
-
91
-
92
-
93
-
94
-
95
-
96
 |
 |

PANERA BREAD COMPANY
NOTES TO THE CONSOLIDATED FINANCIAL STATEMENTS (continued)
58
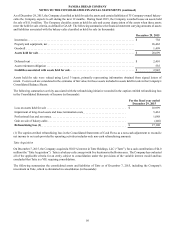
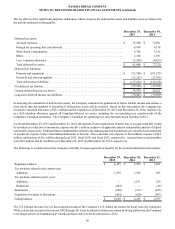
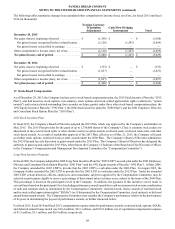
5. Fair Value Measurements
The following summarizes assets and liabilities measured at fair value on a recurring basis (in thousands):
Total
Quoted Prices
in Active
Markets for
Identical Assets
(Level 1)
Significant
Other
Observable
Inputs
(Level 2)
Significant
Unobservable
Inputs
(Level 3)
December 29, 2015:
Cash equivalents . . . . . . . . . . . . . . . . . . . . . . . . . . . $ 2 $ 2 $ — $ —
Total assets. . . . . . . . . . . . . . . . . . . . . . . . . . . . . . . $ 2 $ 2 $ — $ —
Interest rate swap liability. . . . . . . . . . . . . . . . . . . . $ 2,552 $ — $ 2,552 $ —
Total liabilities. . . . . . . . . . . . . . . . . . . . . . . . . . . . $ 2,552 $ — $ 2,552 $ —
December 30, 2014:
Cash equivalents . . . . . . . . . . . . . . . . . . . . . . . . . . . $ 92,316 $ 92,316 $ — $ —
Total assets. . . . . . . . . . . . . . . . . . . . . . . . . . . . . . . $ 92,316 $ 92,316 $ — $ —
The fair value of the Company's cash equivalents is based on quoted market prices for identical securities. The fair value of the
Company's interest rate swaps are determined based on a discounted cash flow analysis on the expected future cash flows of each
derivative. This analysis reflects the contractual terms of the derivatives and uses observable market-based inputs, including
interest rate curves and credit spreads.
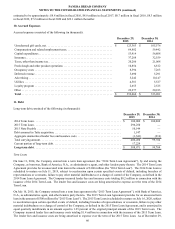
6. Inventories
Inventories consisted of the following (in thousands):
December 29,
2015
December 30,
2014
Food:
Fresh dough facilities:
Raw materials . . . . . . . . . . . . . . . . . . . . . . . . . . . . . . . . . . . . . . . . . . . . . . . . . . . . . . . . . . . $ 3,561 $ 3,413
Finished goods. . . . . . . . . . . . . . . . . . . . . . . . . . . . . . . . . . . . . . . . . . . . . . . . . . . . . . . . . . . 446 460
Bakery-cafes:
Raw materials . . . . . . . . . . . . . . . . . . . . . . . . . . . . . . . . . . . . . . . . . . . . . . . . . . . . . . . . . . . 14,819 15,152
Paper goods. . . . . . . . . . . . . . . . . . . . . . . . . . . . . . . . . . . . . . . . . . . . . . . . . . . . . . . . . . . . . . . . . 3,656 3,786
Total . . . . . . . . . . . . . . . . . . . . . . . . . . . . . . . . . . . . . . . . . . . . . . . . . . . . . . . . . . . . . . . . . . . . . . $ 22,482 $ 22,811