Oracle 2008 Annual Report Download - page 61
Download and view the complete annual report
Please find page 61 of the 2008 Oracle annual report below. You can navigate through the pages in the report by either clicking on the pages listed below, or by using the keyword search tool below to find specific information within the annual report.-
 1
1 -
2
-
3
-
4
-
5
-
6
-
7
-
8
-
9
-
10
-
11
-
12
-
13
-
14
-
15
-
16
-
17
-
18
-
19
-
20
-
21
-
22
-
23
-
24
-
25
-
26
-
27
-
28
-
29
-
30
-
31
-
32
-
33
-
34
-
35
-
36
-
37
-
38
-
39
-
40
-
41
-
42
-
43
-
44
-
45
-
46
-
47
-
48
-
49
-
50
-
 51
51 -
 52
52 -
 53
53 -
 54
54 -
 55
55 -
 56
56 -
 57
57 -
 58
58 -
 59
59 -
 60
60 -
 61
61 -
 62
62 -
 63
63 -
 64
64 -
 65
65 -
 66
66 -
 67
67 -
 68
68 -
 69
69 -
 70
70 -
 71
71 -
72
-
73
-
74
-
75
-
76
-
77
-
78
-
79
-
80
-
81
-
82
-
83
-
84
-
85
-
86
-
87
-
88
-
89
-
90
-
91
-
92
-
93
-
94
-
95
-
96
-
97
-
98
-
99
-
100
-
101
-
102
-
103
-
104
-
105
-
106
-
107
-
108
-
109
-
110
-
111
-
112
-
113
-
114
-
115
-
116
-
117
-
118
-
119
-
120
-
121
-
122
-
123
-
124
-
125
-
126
-
127
-
128
-
129
-
130
-
131
-
132
-
133
-
134
-
135
-
136
-
137
-
138
-
139
-
140
-
141
-
142
-
143
-
144
-
145
-
146
-
147
-
148
-
149
-
150
 |
 |

Table of Contents
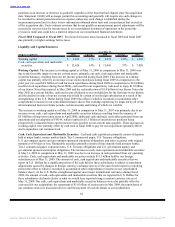
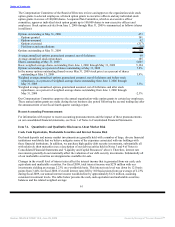
The increase in cash, cash equivalents and marketable securities at May 31, 2008 in comparison to May 31,
2007 is due to the issuance of $5.0 billion of senior notes in April 2008 and an increase in our operating cash
flows resulting primarily from an increase in net income, partially offset by cash used for our acquisitions
(primarily BEA), net repayments of our short-term commercial paper notes, and repurchases of our common
stock.
Days sales outstanding, which is calculated by dividing period end accounts receivable by average daily sales
for the quarter, was 58 days at May 31, 2009 compared with 63 days at May 31, 2008. The days sales
outstanding calculation excludes the adjustment that reduces our acquired software license updates and
product support obligations to fair value. Our decline in days sales outstanding is primarily due to the
improved timeliness of our collections efforts and the mix of our total revenues during the fourth quarter of
fiscal 2009, which weighted more heavily toward our license updates and product support revenues (such
revenues generally have a lower DSO than our revenues from our other operating segments).
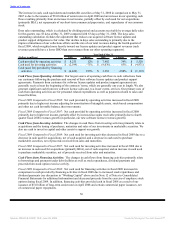
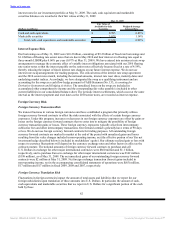
Year Ended May 31,
(Dollars in millions) 2009 Change 2008 Change 2007
Cash provided by operating activities $ 8,255 12% $ 7,402 34% $ 5,520
Cash used for investing activities $ (2,599) -71% $ (9,076) 83% $ (4,971)
Cash (used for) provided by financing
activities $ (4,422) 235% $ 3,281 -388% $ (1,139)
Cash Flows from Operating Activities: Our largest source of operating cash flows is cash collections from
our customers following the purchase and renewal of their software license updates and product support
agreements. Payments from customers for software license updates and product support agreements are
generally received near the beginning of the contracts’ terms, which are generally one year in length. We also
generate significant cash from new software license sales and, to a lesser extent, services. Our primary uses of
cash from operating activities are for personnel related expenditures as well as payments related to taxes and
leased facilities.
Fiscal 2009 Compared to Fiscal 2008: Net cash provided by operating activities increased in fiscal 2009
primarily due to higher net income adjusting for amortization of intangible assets, stock-based compensation
and other net cash favorable balance sheet movements.
Fiscal 2008 Compared to Fiscal 2007: Net cash provided by operating activities increased in fiscal 2008
primarily due to higher net income, partially offset by increased accounts receivable primarily due to fourth
quarter fiscal 2008 revenues growth (in particular, our new software license revenues growth).
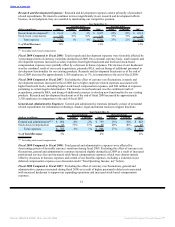
Cash Flows from Investing Activities: The changes in cash flows from investing activities primarily relate to
acquisitions and the timing of purchases, maturities and sales of our investments in marketable securities. We
also use cash to invest in capital and other assets to support our growth.
Fiscal 2009 Compared to Fiscal 2008: Net cash used for investing activities decreased in fiscal 2009 due to a
decrease in cash used for acquisitions, net of cash acquired, and a decrease in cash used to purchase
marketable securities, net of proceeds received from sales and maturities.
Fiscal 2008 Compared to Fiscal 2007: Net cash used for investing activities increased in fiscal 2008 due to
an increase in cash used for acquisitions (primarily BEA), net of cash acquired, and an increase in cash used
to purchase marketable securities, net of proceeds received from sales and maturities.
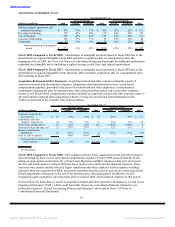
Cash Flows from Financing Activities: The changes in cash flows from financing activities primarily relate
to borrowings and payments under debt facilities as well as stock repurchases, dividend payments and
proceeds from stock option exercise activity.
Fiscal 2009 Compared to Fiscal 2008: Net cash used for financing activities in fiscal 2009 increased in
comparison to cash provided by financing activities in fiscal 2008 due to increased stock repurchases and
dividend payments (see discussion in “Working Capital” above and in Note 12 of Notes to Consolidated
Financial Statements for additional information) and decreased proceeds from the exercise of employee stock
options during fiscal 2009. In addition, financing activities provided cash in fiscal 2008 as a result of our
issuance of $5.0 billion of long-term senior notes in April 2008 and certain commercial paper issuances, net
of commercial paper repayments.
56
Source: ORACLE CORP, 10-K, June 29, 2009 Powered by Morningstar® Document Research℠